
The Misalignment Between Market Valuations and Economic Reality
The S&P 500 has demonstrated a massive surge in its price index relative to underlying fundamentals such as earnings per share (EPS), corporate revenue, and real GDP growth. While the index has seen exponential growth, these key metrics have risen at a far more measured pace, revealing a growing disconnect between stock valuations and the actual health of companies or the broader economy
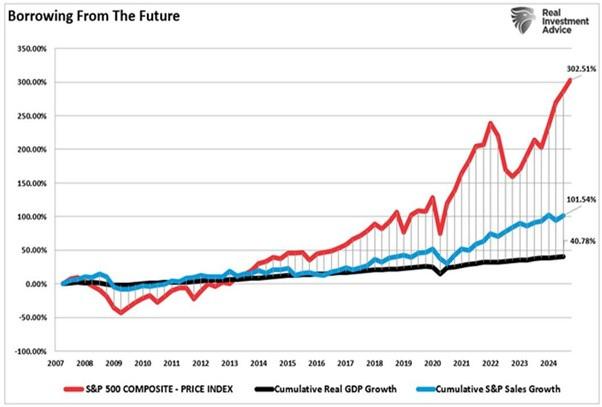
The widening disparity between the growth of the S&P 500 Composite Price Index, cumulative real GDP, and cumulative S&P sales from 2007 to 2024 tells a compelling story of divergence. Over this period, the S&P 500 has surged by a staggering 302.51%, particularly post-2009, reflecting a sharp rise in stock market valuations. In stark contrast, cumulative real GDP has grown by only 40.78%, highlighting a much slower pace of economic expansion. Similarly, cumulative S&P sales have risen by 101.54%, indicating steady but far less explosive growth in corporate revenues compared to stock prices.
This disconnect underscores a critical concern: the growth in asset prices has significantly outpaced the underlying fundamentals. To put it in perspective, the increase in the S&P 500’s valuation is more than seven times the growth in real GDP and roughly three times the rise in corporate revenue. This divergence underscores a key concern: the stock market’s performance has increasingly outstripped the growth of both the broader economy and corporate fundamentals. This disparity highlights the significant role external factors -like corporate stock buybacks-play in driving market exuberance.
These elements can overheat stock prices, pushing them far beyond what fundamentals justify. The downside is that when a downturn comes the corporates may not be able to buy back their stock with the same intensity accentuating any potential bear market.
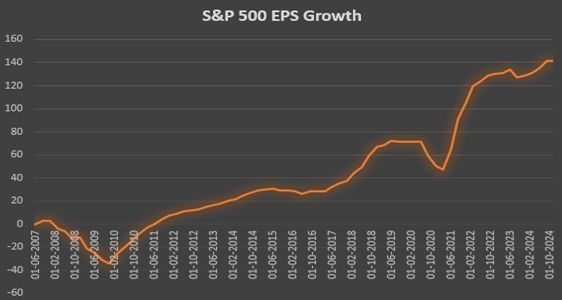
As shown in the charts above, an analysis of the S&P 500’s earnings per share (EPS) from 2007 to 2024 reveals a growth of 141.22%, with a marked acceleration post-2020. Yet, this pales in comparison to the 302.51% rise in the S&P 500 Composite Price Index, highlighting a disproportionate increase in stock prices relative to earnings growth.
S&P 500’s price-to-eanings (P/E) ratio and the cyclically adjusted price-to-earnings (CAPE) ratio remain well above their historical averages. As of late 2024, the CAPE ratio is near levels associated with previous market peaks, reflecting elevated optimism in stock prices despite potential risks
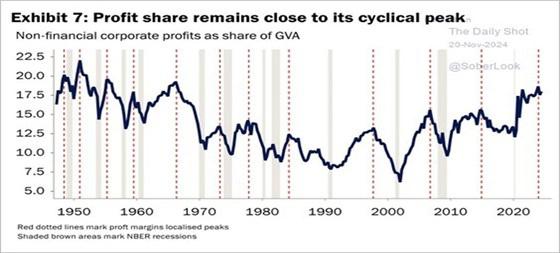
Moreover, profits as a share of gross value added are nearing cyclical peaks. With inflation easing and consumers increasingly constrained by rising credit rejections, corporate profitability may come under greater pressure in the coming year. This adds another layer of vulnerability to the current market valuations even beyond the ever increasing probability of a US led global slowdown between 2025-27.
Conclusion:
Investors should interpret this misalignment as a cautionary signal. The stock market’s performance, while impressive, cannot be blindly trusted as an accurate proxy for economic health or corporate vitality. Such overreliance can obscure deeper vulnerabilities and lead to misaligned expectations for the future. A well-rounded perspective, incorporating macroeconomic indicators and core business fundamentals, is essential for navigating an increasingly distorted market landscape and understanding the true trajectory of the economy and financial markets. We firmly believe that once the current rally in stocks plays out over the next few weeks, the US stock market will be at its most vulnerable than at any other time post the Great depression of the 1930s. This is because of the plateauing economic growth, underwhelming corporate results and unsustainable valuations.


Comments are closed.