
Echoes of 2000, Lessons for 2025: The Rise of Tech and Fall of Safety
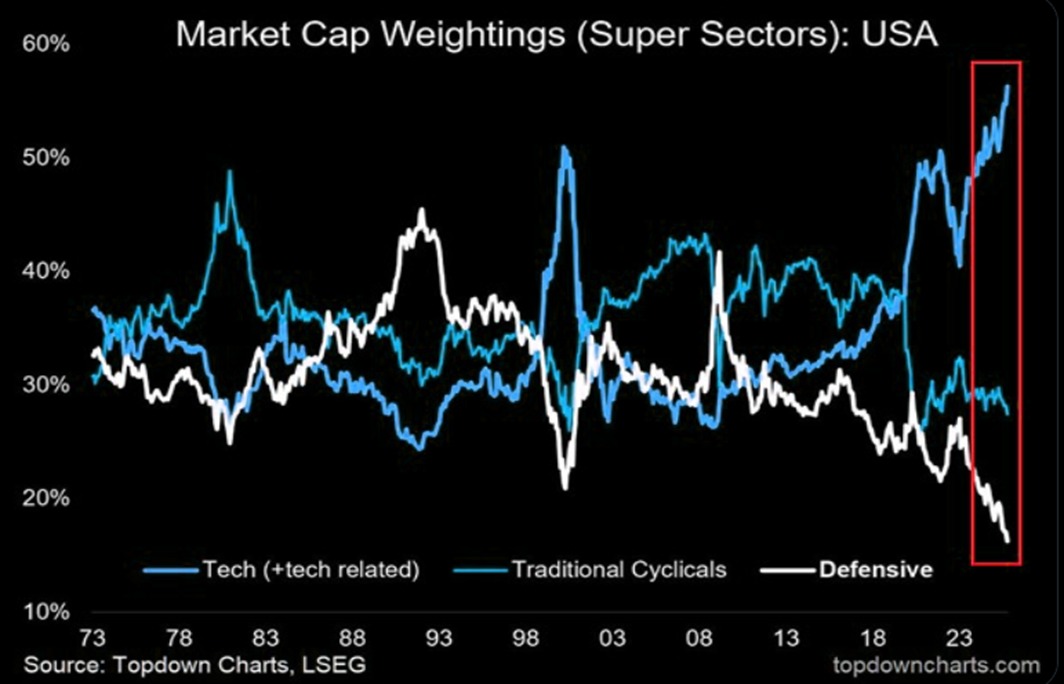
The first chart tracks market-cap weightings across super sectors in the US from 1973 to 2025. The data reveals a striking surge in the Technology sector’s dominance, now exceeding 55% of total market capitalization, the highest in history well above the peaks seen during the Dotcom bubble. Meanwhile, Defensive sectors have collapsed to their lowest share in five decades, and Traditional Cyclicals have remained largely stable. Unlike 1999–2000, when quality and speculative tech ran together, today’s rally is narrowly concentrated in a handful of mega-cap technology names.
This extreme concentration signals investor complacency: while confidence in innovation and growth is high, the market is increasingly vulnerable to shocks. Every time the market tilts so heavily toward a single sector, vulnerability rises and the risk-return profile becomes skewed, with upside limited to a few names while downside risk spreads across the index. A slowdown in AI adoption, or earnings disappointments from just a handful of mega caps could trigger outsized declines.
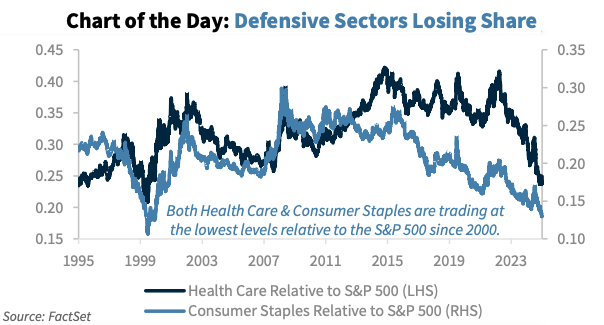
The second chart sharpens this narrative by zooming into Health Care and Consumer Staples, the core of defensives. Both are now trading at their lowest relative weights to S&P 500 since 2000a stark signal that investors are abandoning traditional safety nets. Historically, such deep under weights have coincided with late-cycle overconfidence, when optimism about economic resilience masks rising risks of a downturn.
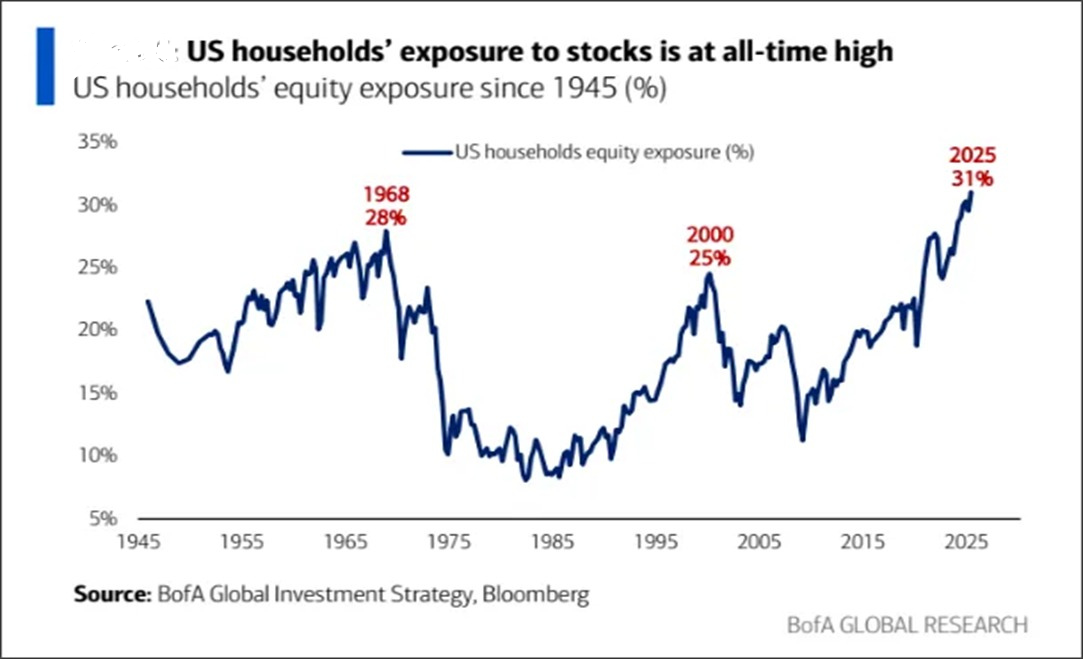
Now this third chart tracks US households’ equity exposure since 1945, showing that household exposure has surged to 31% in 2025, the highest on record, surpassing prior peaks of 28% in 1968 and 25% in 2000. This underscores that retail investors are heavily invested in equities at a point when market concentration risk is elevated. High household equity exposure magnifies systemic vulnerability: even a modest correction in these dominant tech names could trigger significant losses in household wealth, sharply dent investor confidence, and set off a cascade of selling, intensifying volatility across the market.
Conclusion
Together, these charts paint a cautionary picture: the US equity market is structurally imbalanced, heavily reliant on technology mega caps for returns while defensives provide minimal cushioning against volatility. Household equity exposure is at an all-time high, adding another layer of fragility. This setup has amplified gains but also concentrated risk, making the index more sensitive to sector-specific shocks, regulatory headwinds, and changes in investor sentiment.
Every time the market reaches these extreme levels of concentration, vulnerability intensifies, and the risk-return tradeoff becomes asymmetrical: gains may be concentrated in a few names, but losses if triggered can be broad and severe. Investors are effectively betting that technological disruption and profitability will continue indefinitely a mindset reminiscent of the Dotcom era. History warns that such extreme imbalances rarely persist. Market corrections could emerge through sector rotation, valuation normalization, or broader macroeconomic shocks.
In essence, the current landscape reflects confidence without caution: high returns have lulled investors into ignoring mounting vulnerabilities. While tech leadership drives near-term gains, the potential for a sharp mean-reverting correction/ reversal is elevated, and portfolios lacking exposure to defensive sectors are exposed to even more outsized downside risks.


Comments are closed.