
AI Infrastructure Spending Is Entering a New Growth Phase?
This chart highlights that the ongoing AI-driven data center buildout is evolving into one of the largest capital projects in modern history. In just six years, global data center capex has already approached $930 billion, surpassing or matching the inflation-adjusted costs of many historic megaprojects such as the Apollo Program, the Interstate Highway System, the...
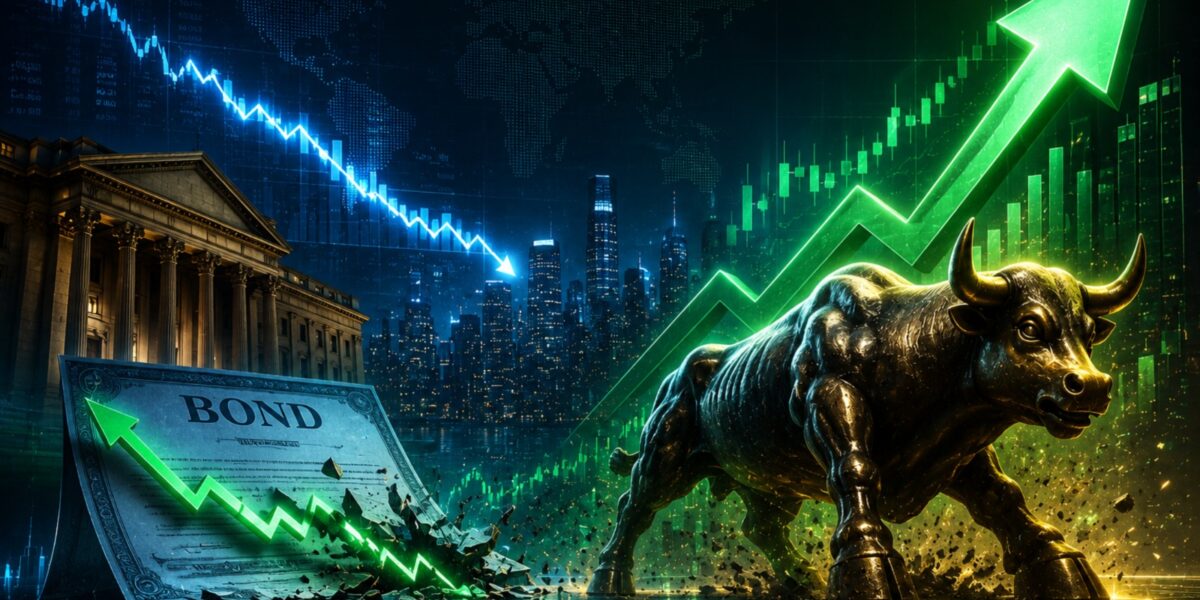
If Bond Yields Fall, The Next Leg of the Bull Market May Begin
This chart shows that global long-term bond yields have risen to their highest level since the 2008 financial crisis, marking a significant normalization of financial markets after years of ultra-low interest rates and abundant liquidity. While higher yields reflect concerns around inflation, government borrowing, and fiscal deficits, they also signal stronger nominal growth expectations and...
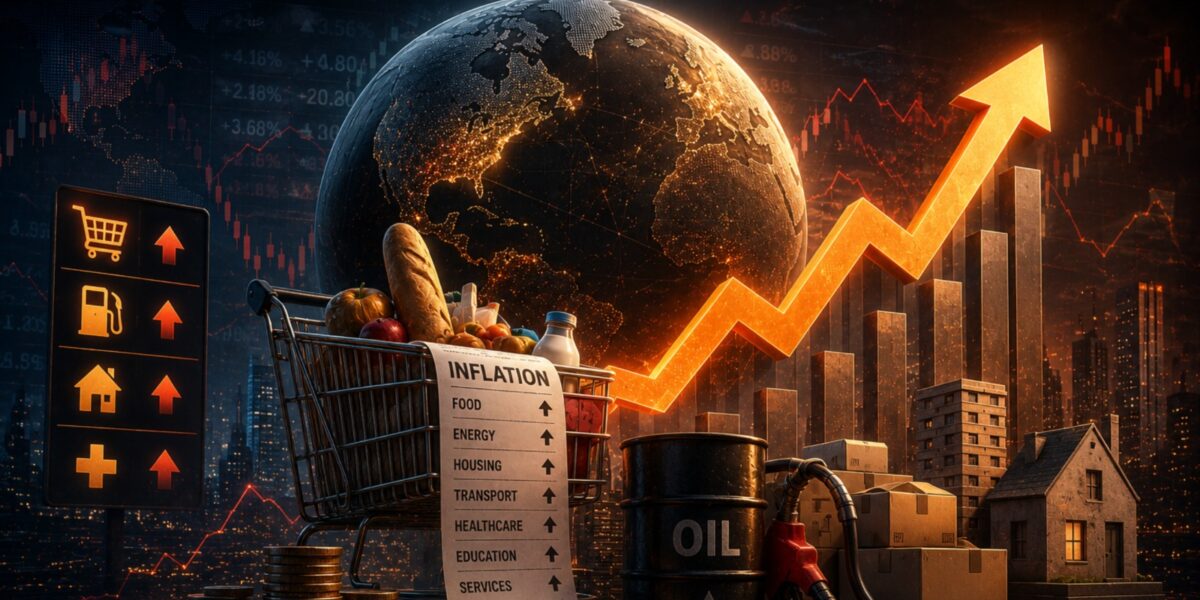
Persistent Inflation Is Becoming a Structural Global Risk
This chart shows that inflation is once again rising faster than wage growth, creating renewed pressure on consumers and weakening real purchasing power. The recent rise in inflation has been driven largely by higher oil prices and geopolitical tensions linked to the Iran conflict, making essentials like fuel, food, and transportation more expensive. At the...

Extreme Dependence on AI Is Reshaping the Economy
This chart highlights how strongly the current S&P 500 earnings growth is being driven by artificial intelligence spending. In 2026, nearly 42% of total EPS growth is expected to come from AI-related investment, with the largest contribution coming from AI infrastructure such as semiconductors, datacenters, networking systems, and computing hardware, while AI cloud services contribute...
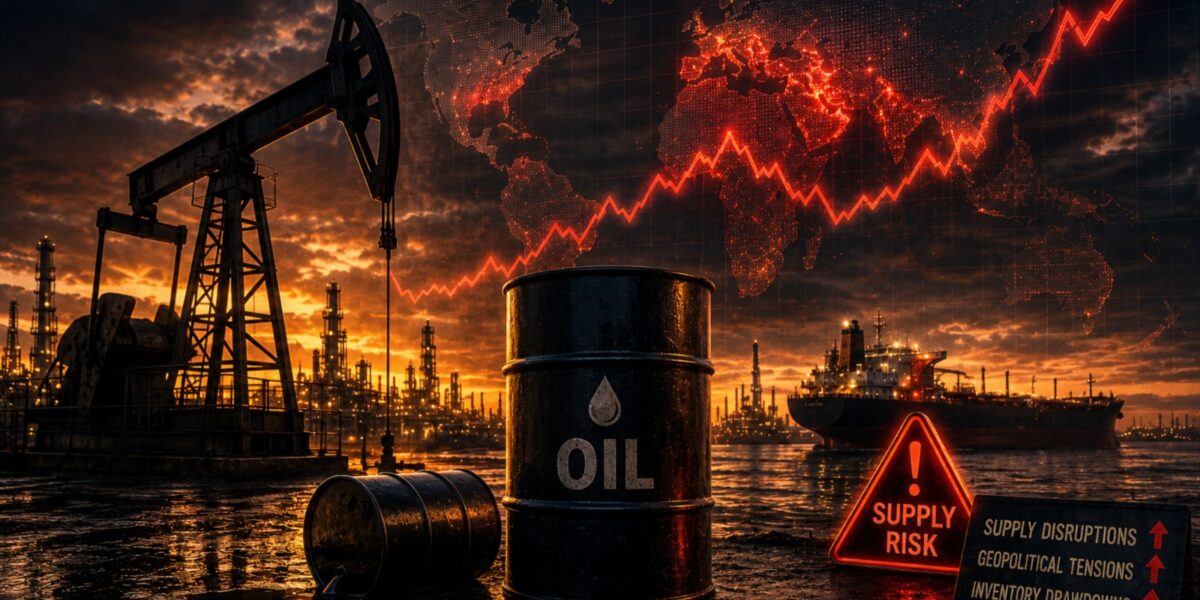
The Great Supply Shock: Oil Markets Enter a Fragile Phase
This chart shows that global oil inventories are falling rapidly and could soon approach critically low operational levels if current supply disruptions continue. The recent decline accelerated after rising geopolitical tensions in the Middle East, particularly around the Iran–Israel conflict escalation, highlighting how dependent global energy markets remain on the region. Inventories act as...

From Gulf to Global: The Hidden Link Driving Food Inflation
This chart highlights a strong relationship between oil prices and global food inflation—when crude oil rises...
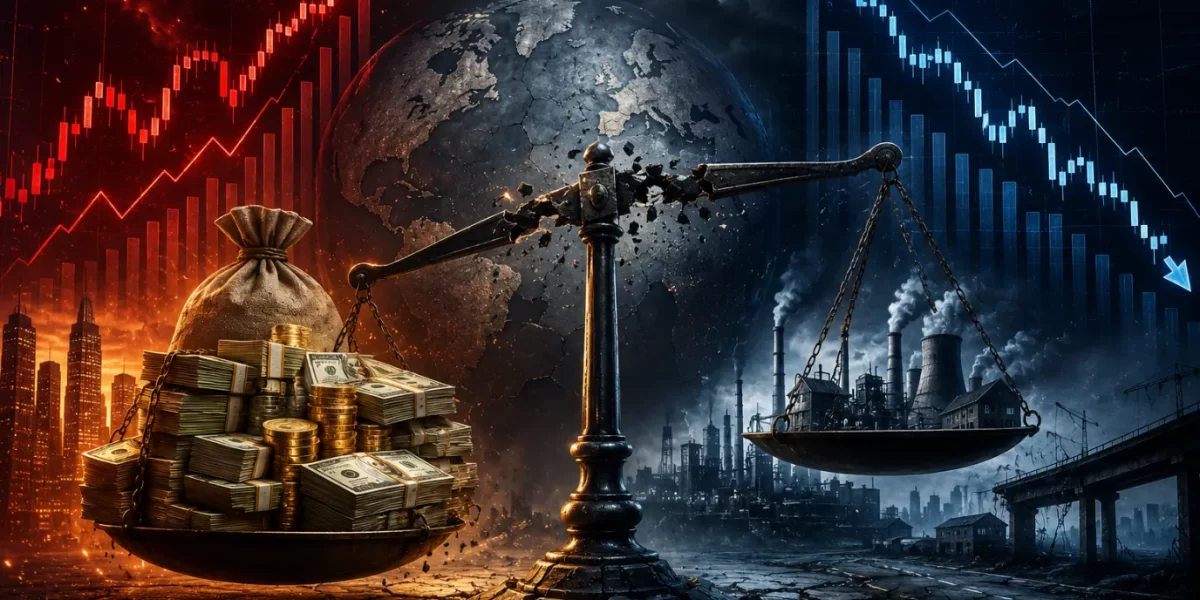
The Great Imbalance: Rising Debt, Slowing Economic Momentum
The chart highlights a critical shift in the global macro landscape: while absolute global debt has continued to climb relentlessly
When Liquidity Expands but Growth Contracts
This chart highlights that global liquidity has reached an extremely elevated level, with total broad money

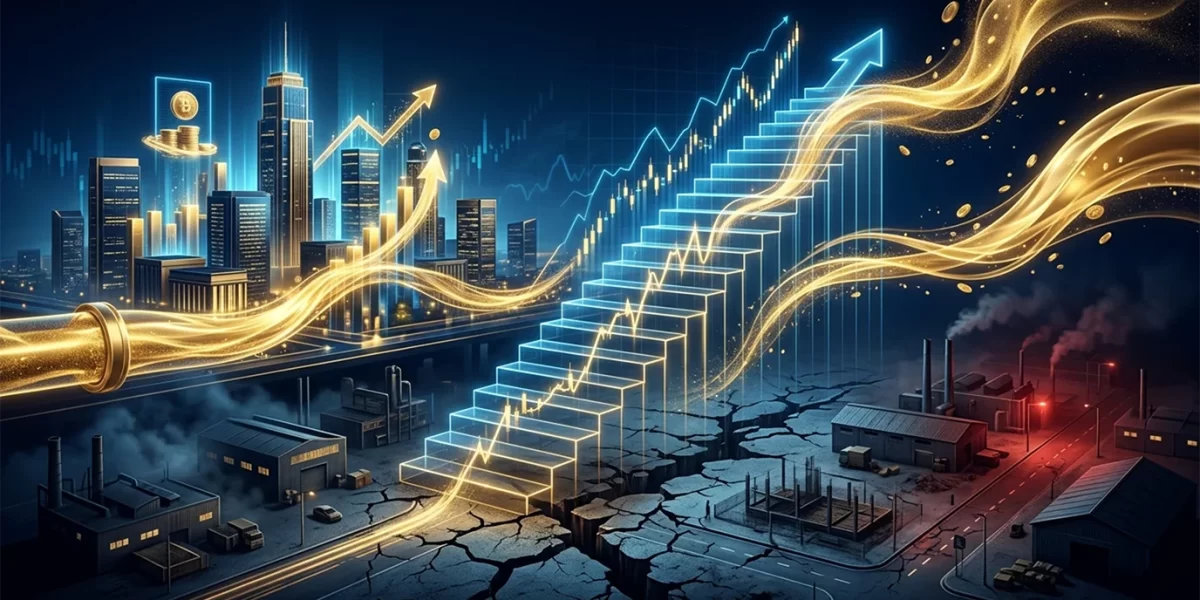
This Reset Is Building the Next Bull Run
The chart indicates that the forward valuation of the S&P 500 has declined and is now hovering around...

Market Corrections Create Opportunity, Not Fear
The chart shows that the valuation premium of MSCI India Index over both the MSCI All Country World Index