
When Liquidity Expands but Growth Contracts
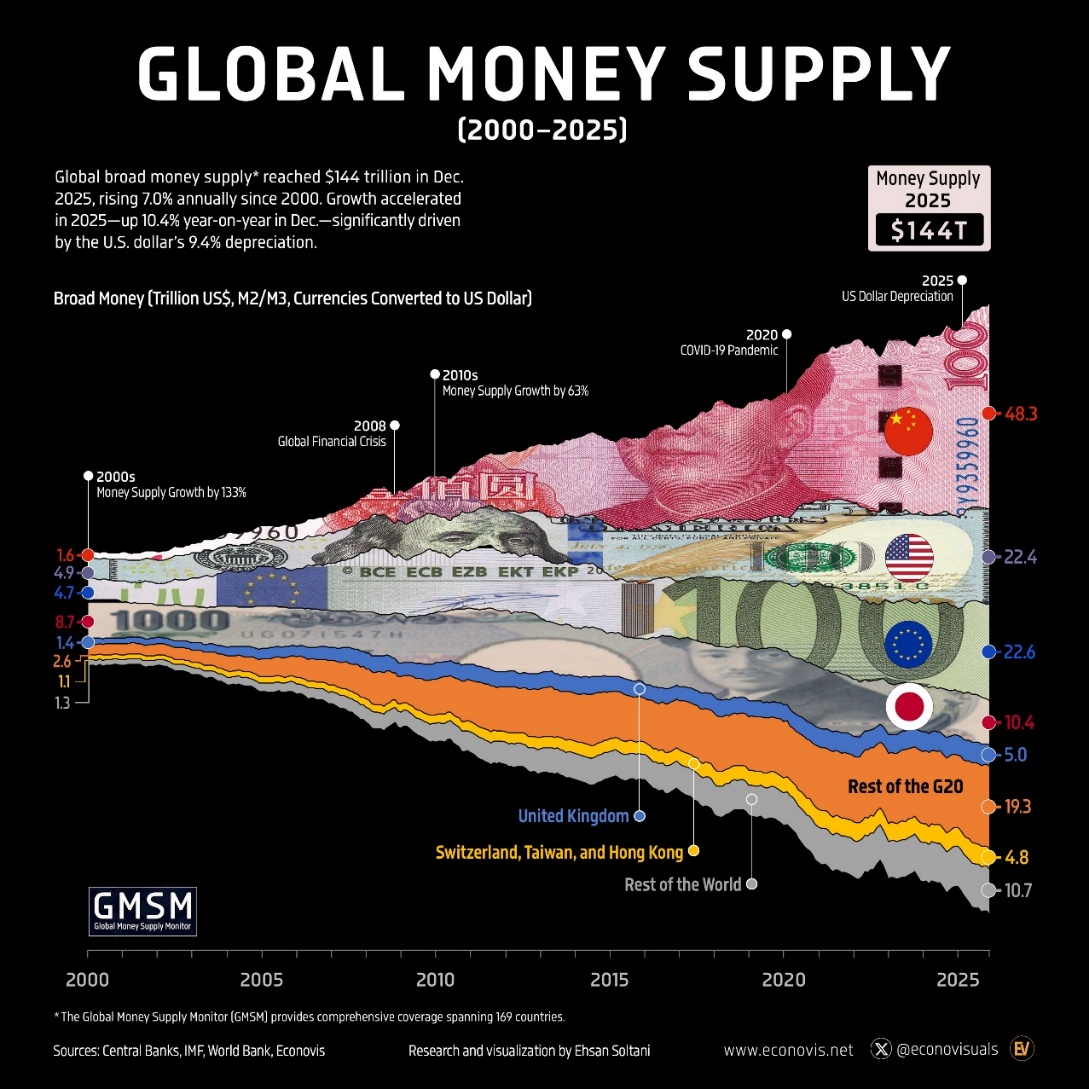
This chart highlights that global liquidity has reached an extremely elevated level, with total broad money (M2 + M3) touching around $144 trillion in 2025, driven by years of monetary expansion across major economies like the United States, China, European Union, and Japan. However, when aligned with the earlier chart, the key shift is that central banks are no longer expanding their balance sheets and are instead in a stagnant or declining phase.
In the near term, this large pool of existing liquidity continues to support financial markets and keeps asset prices relatively stable despite tighter conditions. But since this liquidity is not being actively expanded anymore, its impact is gradually weakening. This creates a late-cycle environment where money is present in the system but not flowing efficiently into real economic growth.
Overall, while high liquidity acts as a short-term cushion, the combination of slowing policy support and already elevated money supply increases the risk of imbalances, making the global economy more sensitive to slowdowns and less resilient over time.
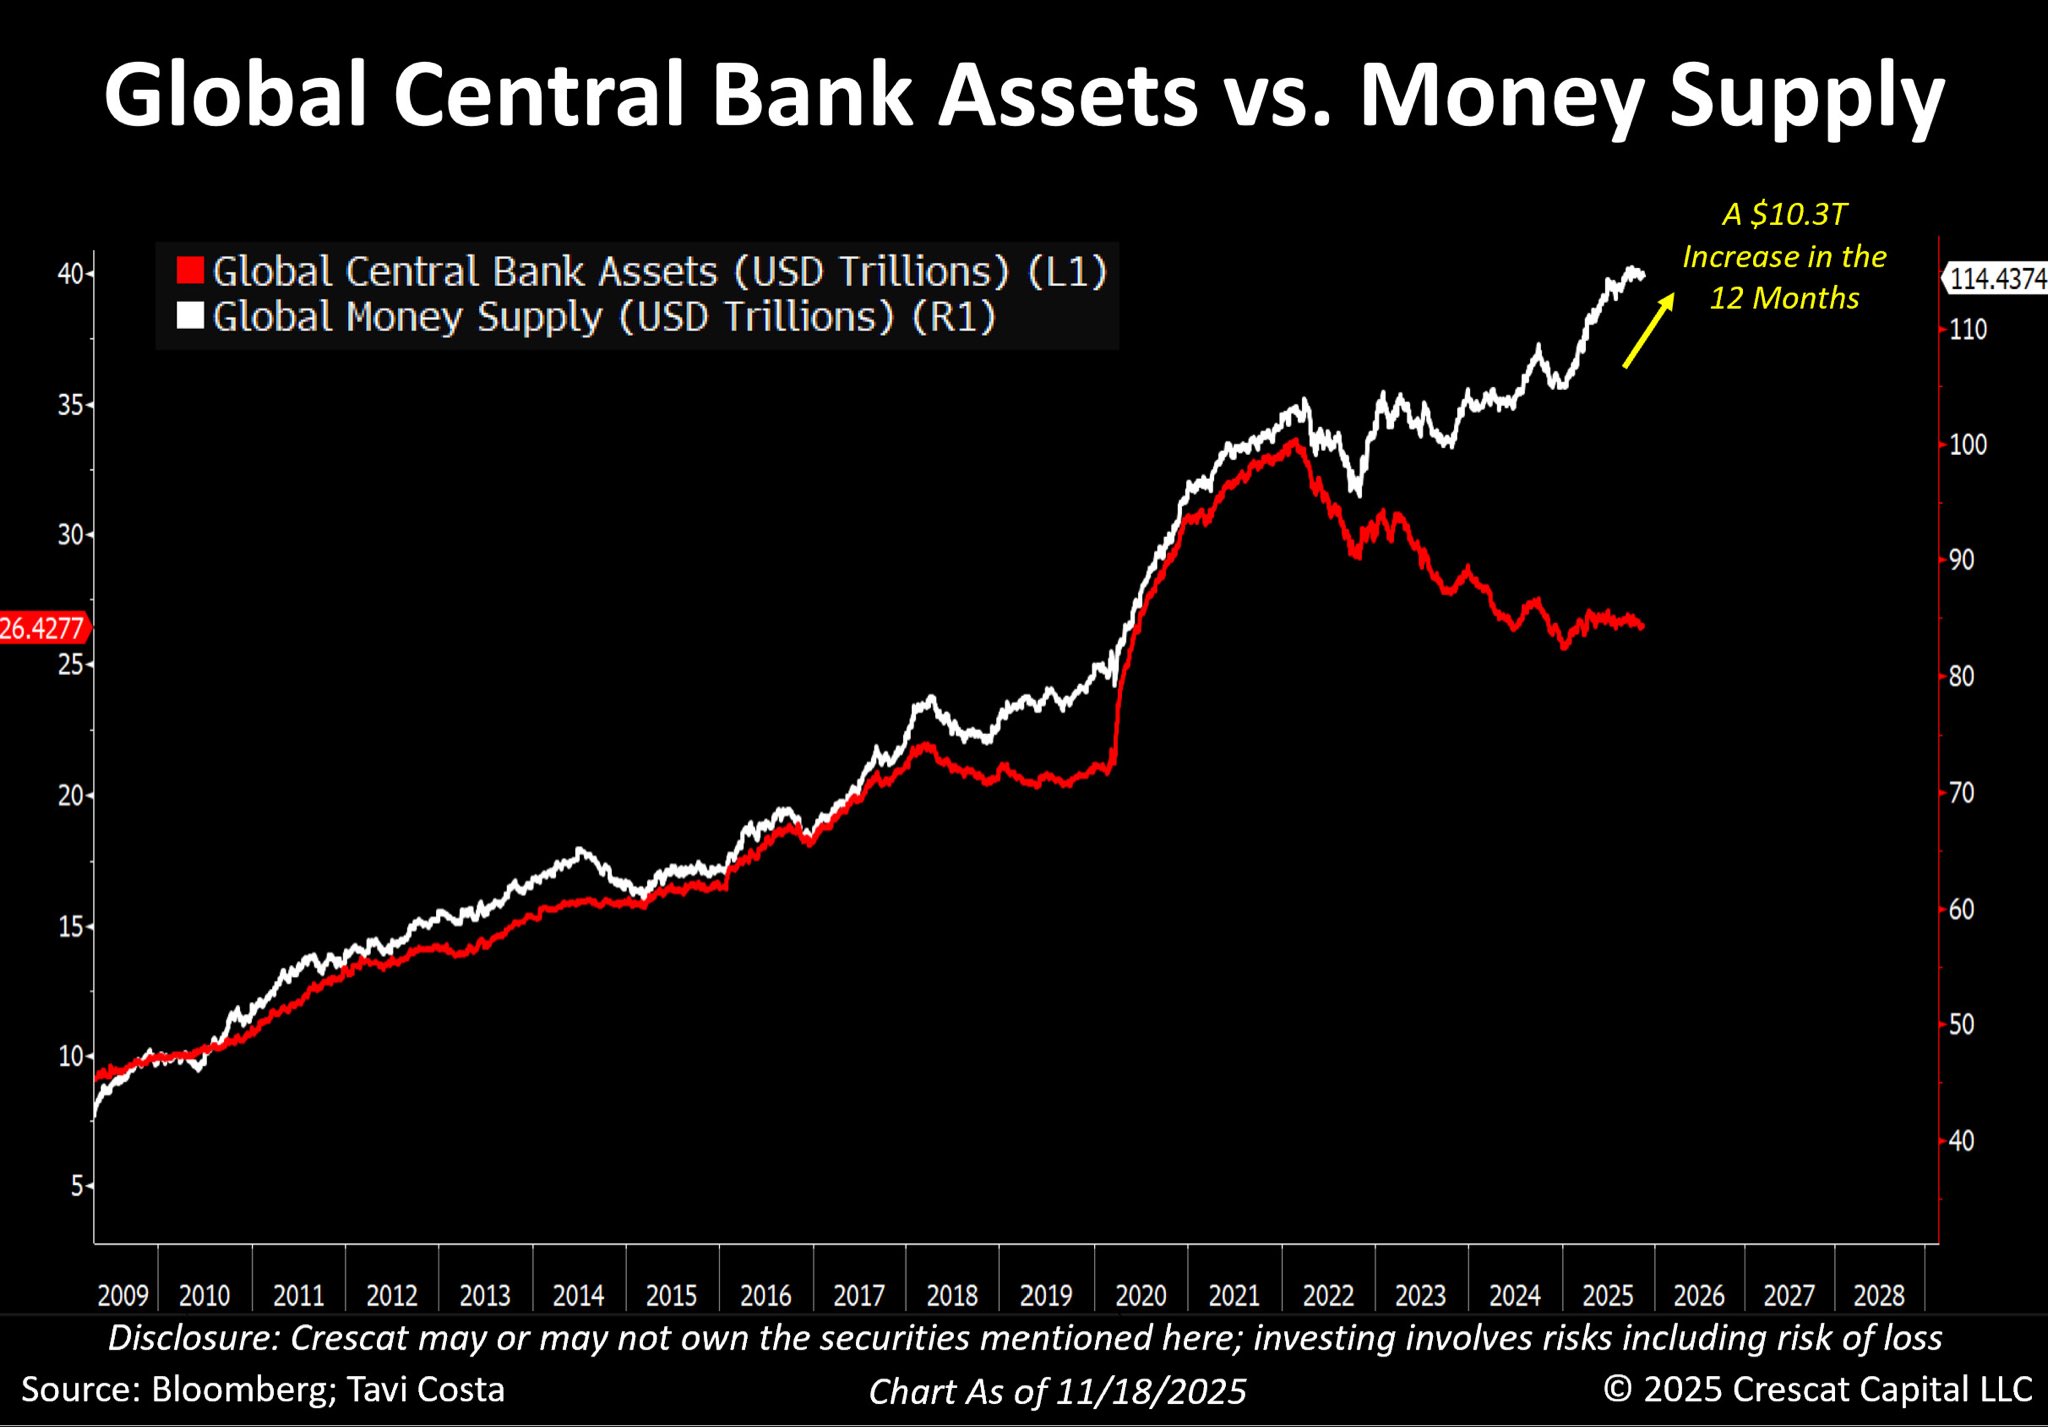
This chart, when compared with the earlier $144T global money supply figure, shows the difference between total liquidity in the system and actively effective liquidity. The ~$114T level here reflects a more core or market-relevant liquidity measure (closer to M2), while the $144T includes broader components (M2 + M3), which are not all immediately flowing into the economy or markets.
The key takeaway is the divergence: global money supply (white line) is still rising, indicating overall liquidity expansion, but central bank assets (red line) are declining or stagnant, meaning institutions like the Federal Reserve and European Central Bank are no longer adding fresh liquidity and are, in fact, in a tightening phase.
This creates a situation where liquidity exists in large amounts, but without continuous central bank support, its effectiveness is reducing. As a result, even though the total pool of money is very high (as seen in the $144T figure), the portion that actively supports growth and markets is relatively constrained. Overall, this divergence signals a late-cycle environment where excess liquidity remains in the system, but weakening policy support makes the global economy more vulnerable to slowdowns and financial stress. At some point of time, the excess liquidity in the system will create even more serious problems for the global economy and financial markets.
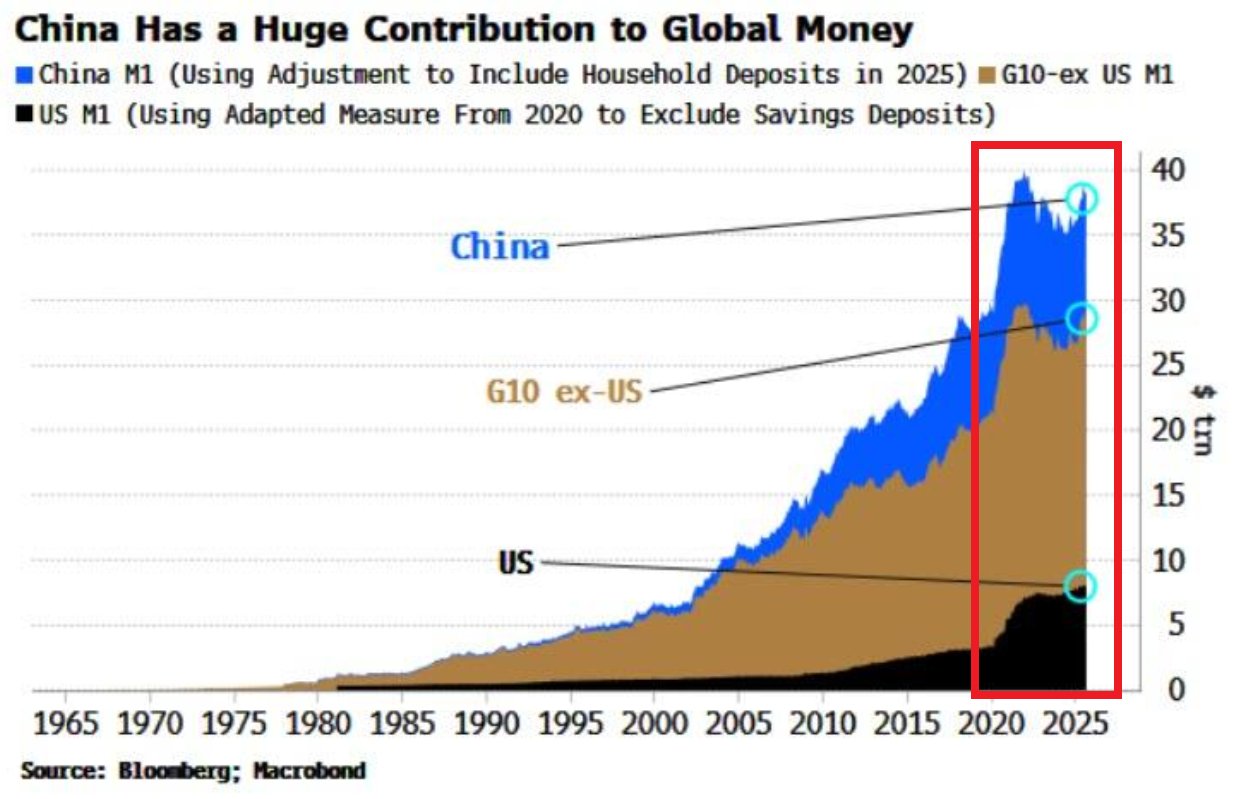
The gap in M1 between China and the United States reflects not just size but the nature of liquidity. M1, which includes cash and demand deposits, represents the most active and immediately spendable money in the economy. In China, a larger share of M1 is driven by corporate and state-linked deposits, meaning liquidity flows more directly into business activity and investment, leading to faster economic transmission. In contrast, U.S. M1 is more concentrated in household deposits and has seen slower growth due to tighter policy by the Federal Reserve. As a result, China’s higher M1 indicates stronger active liquidity driving the current cycle, while the U.S. lags in incremental money creation, reinforcing a shift in global liquidity dynamics toward China.
Conclusion
In conclusion, the current setup points to a structurally fragile backdrop where the pace of global liquidity expansion is not aligned with tightening financial conditions. If growth begins to slow under these constraints, it can quickly turn into a burden on economies by restricting credit flow and weakening demand. At the same time, the rapid rise in overall money supply increases the risk of underlying pressures building up again. This combination creates a difficult environment where any slowdown could amplify stress across markets while keeping macro stability uncertain in the near to medium term.


Comments are closed.