Echoes of 2000, Lessons for 2025: The Rise of Tech and Fall of Safety
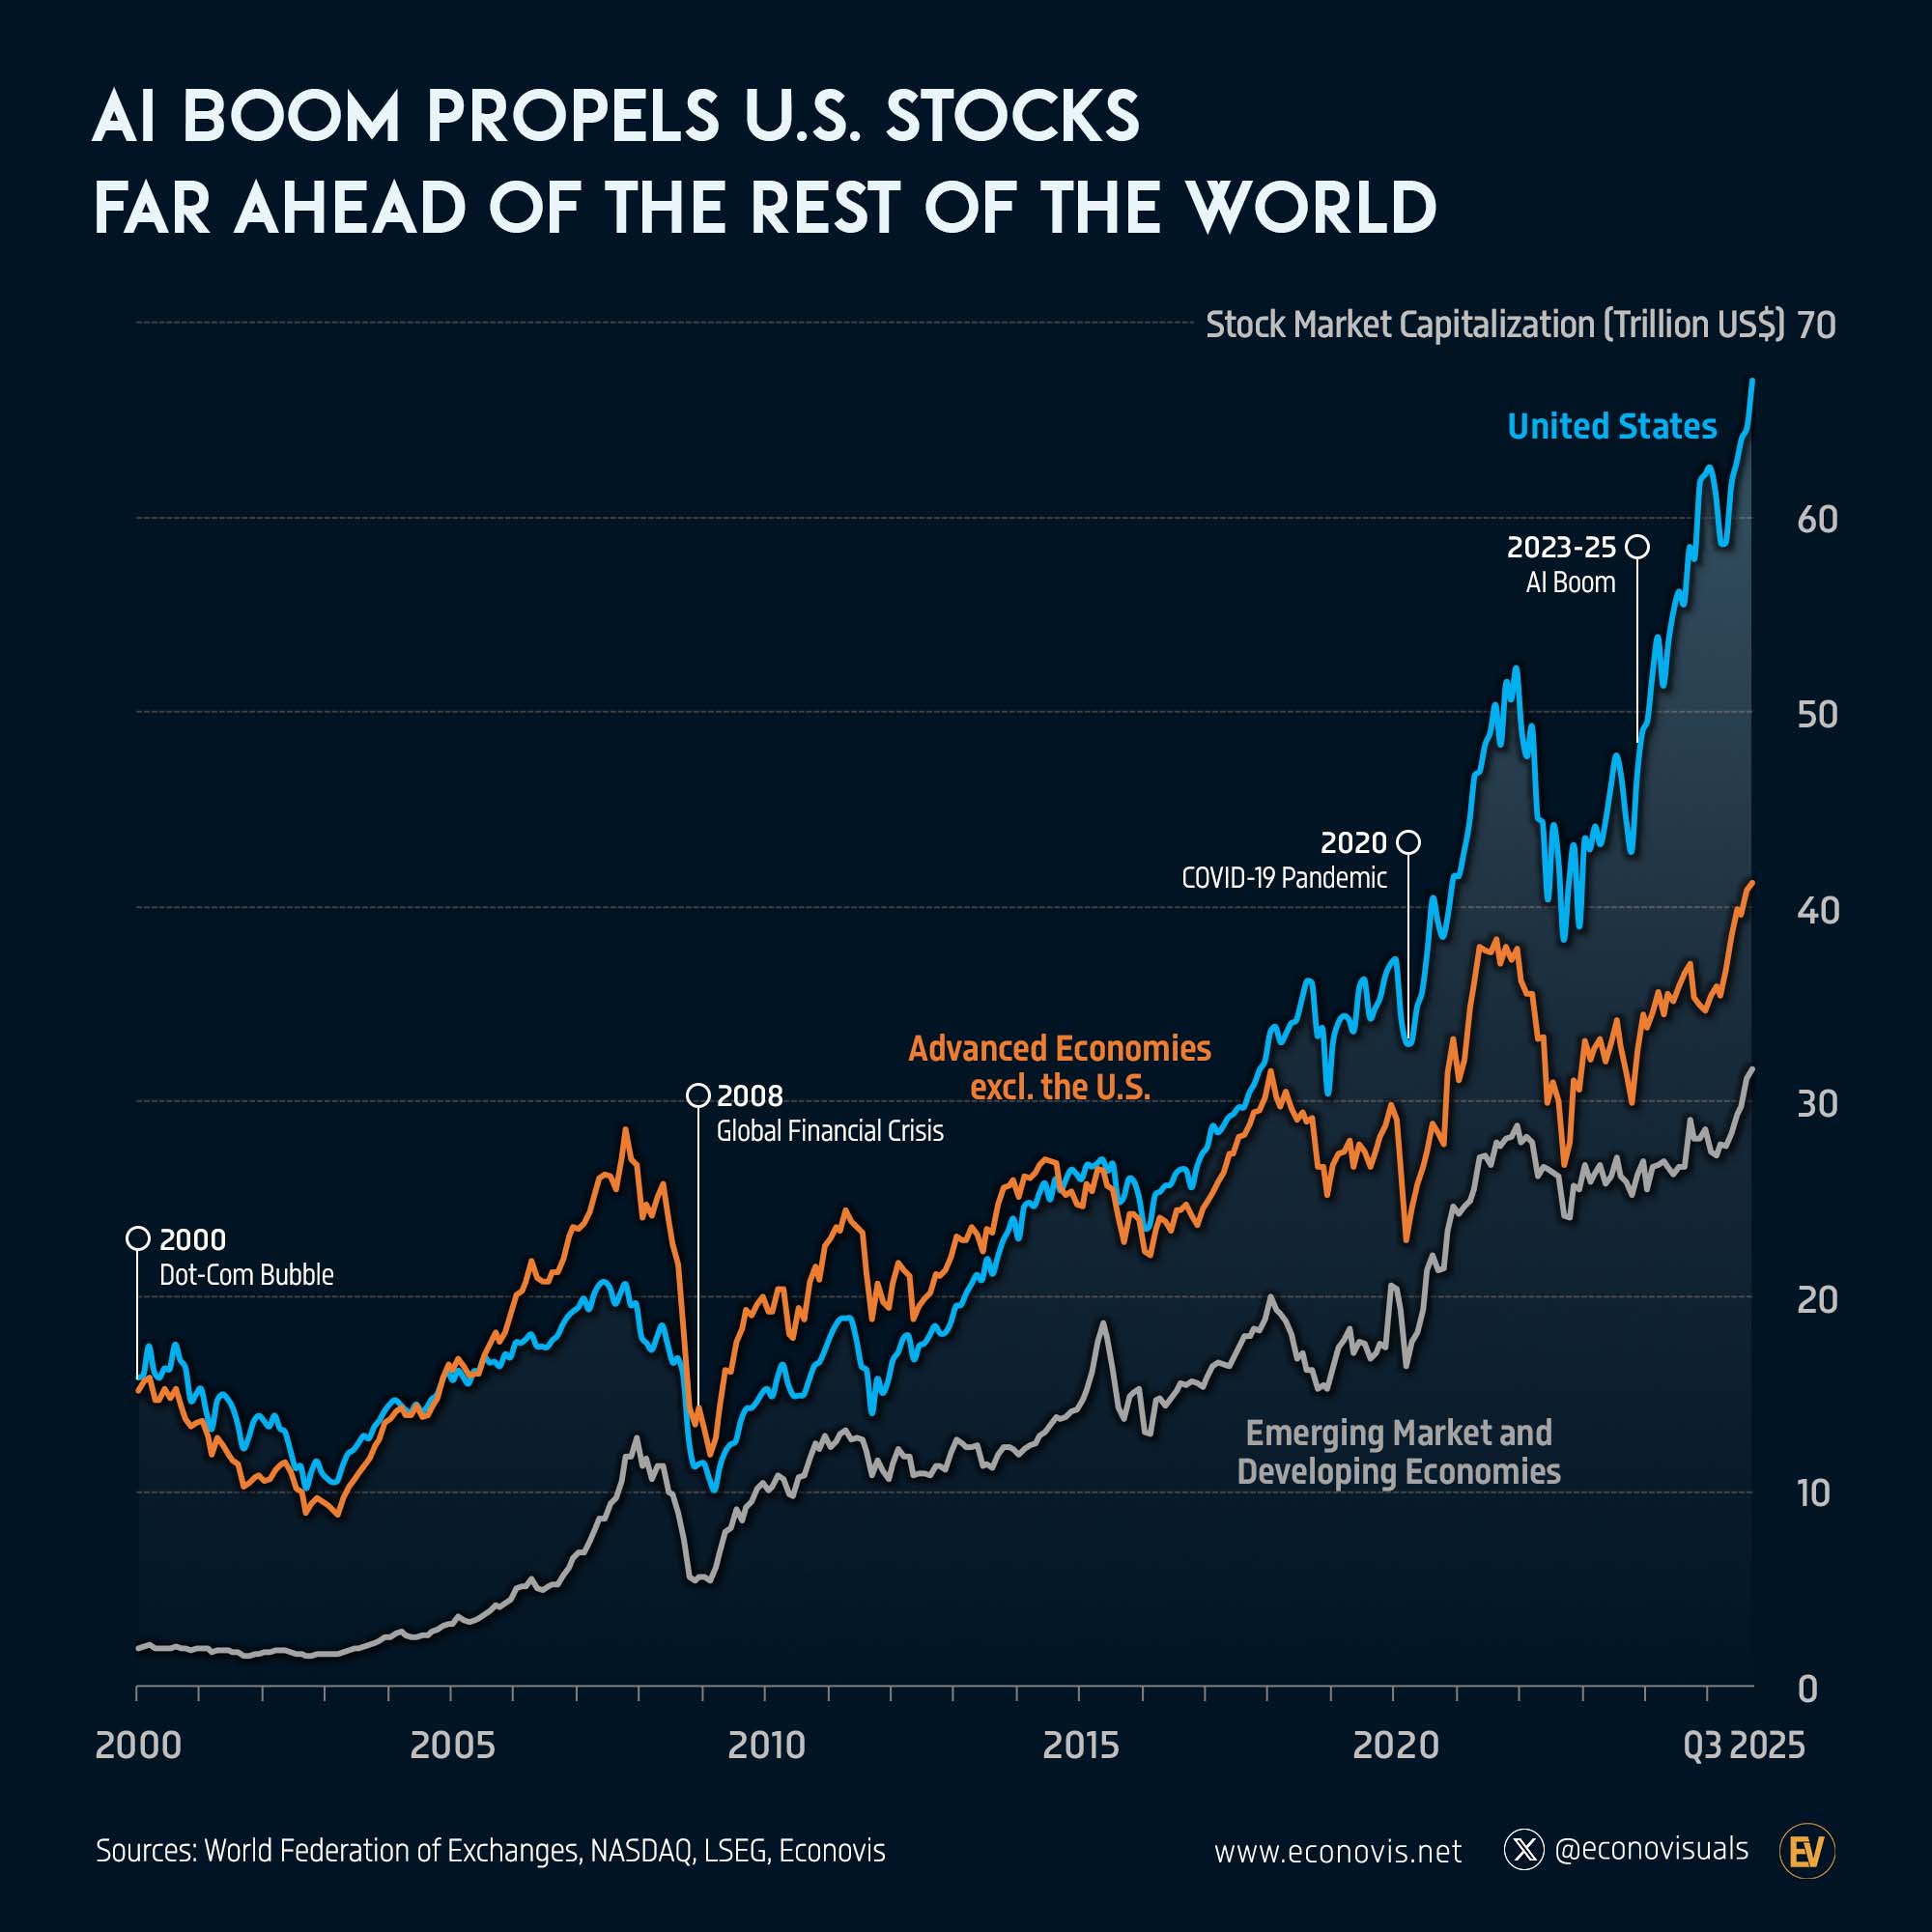
The chart shows how U.S. stock market capitalization has surged far ahead of the rest of the world, driven largely by the 2023–25 AI boom, which pushed U.S. market value to nearly $70 trillion by Q3 2025. Historically, U.S. markets tracked closely with other advanced economies—especially through periods like the 2000 Dot-Com Bubble, the 2008 Global Financial Crisis, and the 2020 COVID-19 pandemic, where both the U.S. and advanced economies excluding the U.S. moved in a similar pattern. However, post-2020, U.S. equities, led by Tech began breaking away sharply, with the divergence accelerating dramatically from 2023 onward as AI investments, semiconductor demand, data-center expansion, and big-tech earnings exploded. This AI-driven rally has been amplified by record-high corporate spending in the U.S. on GPUs, cloud infrastructure, and model-training capacity—levels of capex that other regions simply cannot match. In contrast, advanced economies excluding the U.S. grew steadily, reaching around $40 trillion, but without the steep AI-led re-rating seen in America. Meanwhile, emerging and developing economies expanded at a slower and more volatile pace, rising from under $5 trillion in the early 2000s to just above $20 trillion by 2025. Overall, the chart highlights a structural shift: the U.S. has entered a new leadership phase powered by AI scale, technological dominance, and unmatched investment intensity, leaving both advanced peers and emerging markets significantly behind in market capitalization growth.
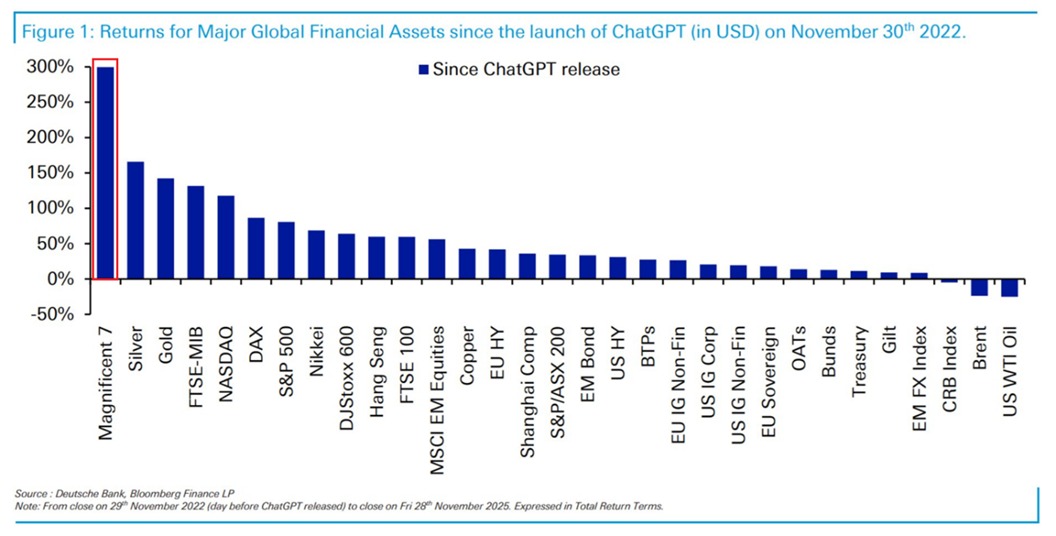
The second chart reinforces the same pattern seen in the earlier analysis: the AI boom has pushed the U.S. far ahead of the rest of the world, not only in market capitalization but also in returns across major asset classes. Since the launch of ChatGPT in November 2022, the Magnificent 7 have delivered nearly 300% returns, dwarfing every other global asset—evidence of how concentrated and U.S-centric the AI-driven rally has become. Precious metals like silver and gold follow with strong gains, but all global equity indices lag far behind, echoing the earlier chart’s message that non-U.S. markets have participated (with Italy and Germany outperforming most others) but without the explosive AI re-rating seen in America. Emerging-market assets, including MSCI EM, Shanghai Composite, and copper, show modest returns, consistent with their slower market-cap growth. Meanwhile, fixed-income categories—EM bonds, U.S. HY, IG credit, BTPs, OATs, Bonds, Treasuries—deliver minimal returns, reflecting the drag from high global interest rates. At the bottom, EM FX, the CRB Index, Brent, and WTI oil turn negative, underscoring the weakness in commodity-led economies during this AI cycle. Together, both charts highlight the same structural shift: the U.S. has pulled into a league of its own because its companies are driving—and heavily spending on—the AI revolution, while the rest of the world is benefiting only marginally. This growing gap signals both the power of U.S. technological leadership and the rising fragility of a global market increasingly dependent on a handful of AI-focused American mega caps.
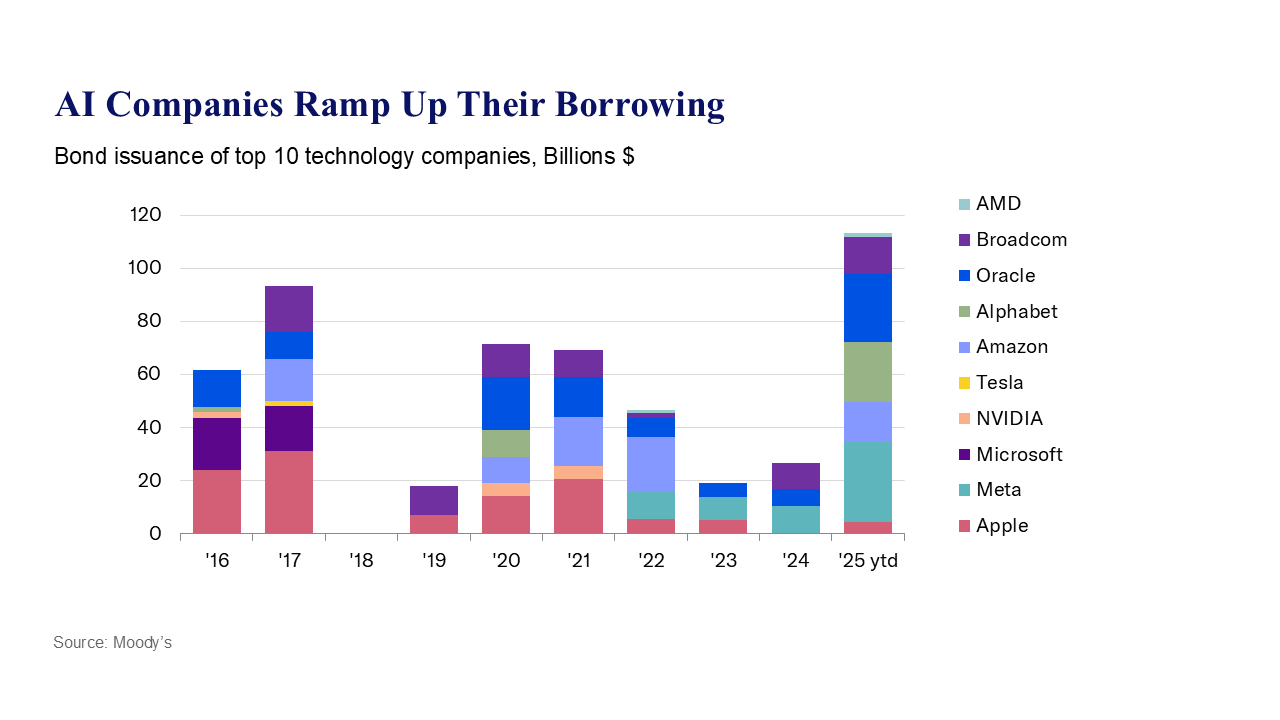
This chart highlights the funding side of the AI expansion, showing a sharp acceleration in bond issuance by leading technology companies as AI capex ramps up. The scale and speed of borrowing into 2025 indicate that AI investment has moved into a highly capital-intensive phase, increasingly reliant on debt rather than organic cash generation.
The implication for equity markets is rising vulnerability. As leverage builds, AI returns must remain exceptionally strong to justify ongoing spending. Any slowdown in monetization, margin pressure, or tightening in financial conditions would quickly compress free cash flows and force a valuation reset.
This dynamic elevates correction risk: while aggressive capex supports near-term growth narratives, it also reduces tolerance for disappointment. The same firms driving market leadership now carry higher balance-sheet risk, making equities more sensitive to shifts in earnings visibility, interest rates, or credit spreads.
Conclusion
Across all three charts, the market signal is clear: global equity leadership and returns have become highly concentrated, while the underlying AI investment cycle is scaling at an unprecedented pace. The transition from innovation-led growth to capital-intensive expansion has raised the system’s dependence on sustained, flawless execution.
AI spending is now being pushed far ahead of proven utilization and cash-flow certainty, increasing the risk of diminishing marginal returns. As capital intensity rises, valuation support becomes more fragile, balance-sheet flexibility narrows, and the tolerance for earnings disappointment drops sharply.
This shifts the correction risk from macro or liquidity shocks to capex discipline itself. If AI investment continues to accelerate without commensurate economic payoff, the adjustment is likely to be abrupt rather than gradual—making hyper-AI capex the central vulnerability of the current equity market regime.


Comments are closed.