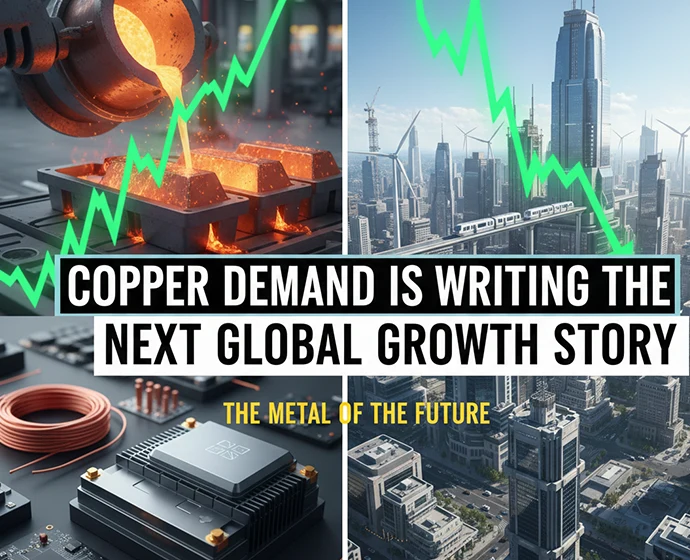
Copper Demand Is Writing the Next Global Growth Story
Copper’s breakout to record highs is increasingly reflecting a structural repricing rather than a cyclical spike, with the...
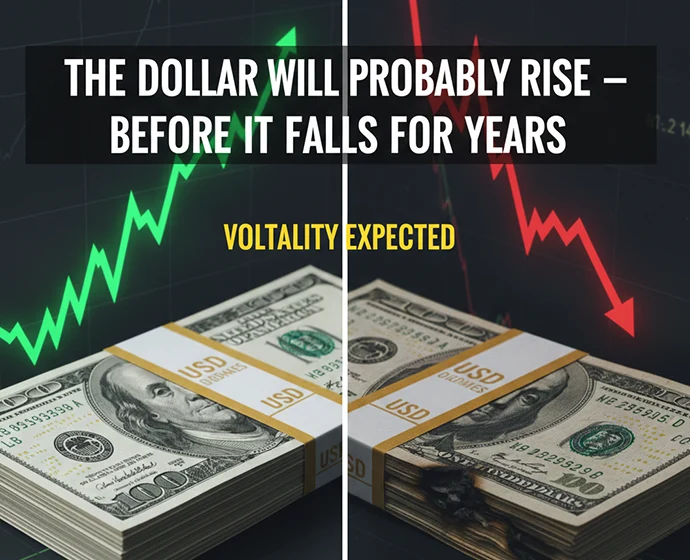
The Dollar Will probably Rise — Before It Falls for Years
The chart shows the Bloomberg Dollar Spot Index falling ~8% in 2025, its worst annual decline in eight years, marking a clear...

AI Capex: The Next Equity Shock
The chart shows how U.S. stock market capitalization has surged far ahead of the rest of the world, driven largely by ...

Echoes of 2000, Lessons for 2025: The Rise of Tech and Fall of Safety
The first chart tracks market-cap weightings across super sectors in the US from 1973 to 2025. The data reveals a striking surge in...

How Rising Household Debt Is Reshaping India’s Macro Landscape
This chart highlights India’s sharp build-up in non-housing household debt, which has climbed to over 29% of GDP

EM Rally Looks Stretched: A Turning Point Ahead?
This first chart shows the positioning of asset managers (black) and leveraged funds (brown) in MSCI...

The Illusion of Affordability: Housing Wealth’s Generational Shift
This first chart shows the dramatic moves in inflation-adjusted home prices and mortgage rates...

Record Tech Concentration, Fading Profits: A Market onThin Ice
This first chart shows that US technology and tech-related stocks now make up 55% of total market cap the highest share...

Big Tech vs the Rest: A Historic Divergence in Tech Market Performance
The above chart shows how the market is paying up for growth, with large-cap tech delivering a +16% surge...

China’s Ghost Growth: Cement, Debt & the Illusion of Productivity
Between 2011 and 2013, China consumed 6.6 billion tonnes of cement, more than the US did in the entire 20th century.