
From Chaos to Comeback: Why Indian Equities Could Deliver a Powerful Reversion To The Mean Rally
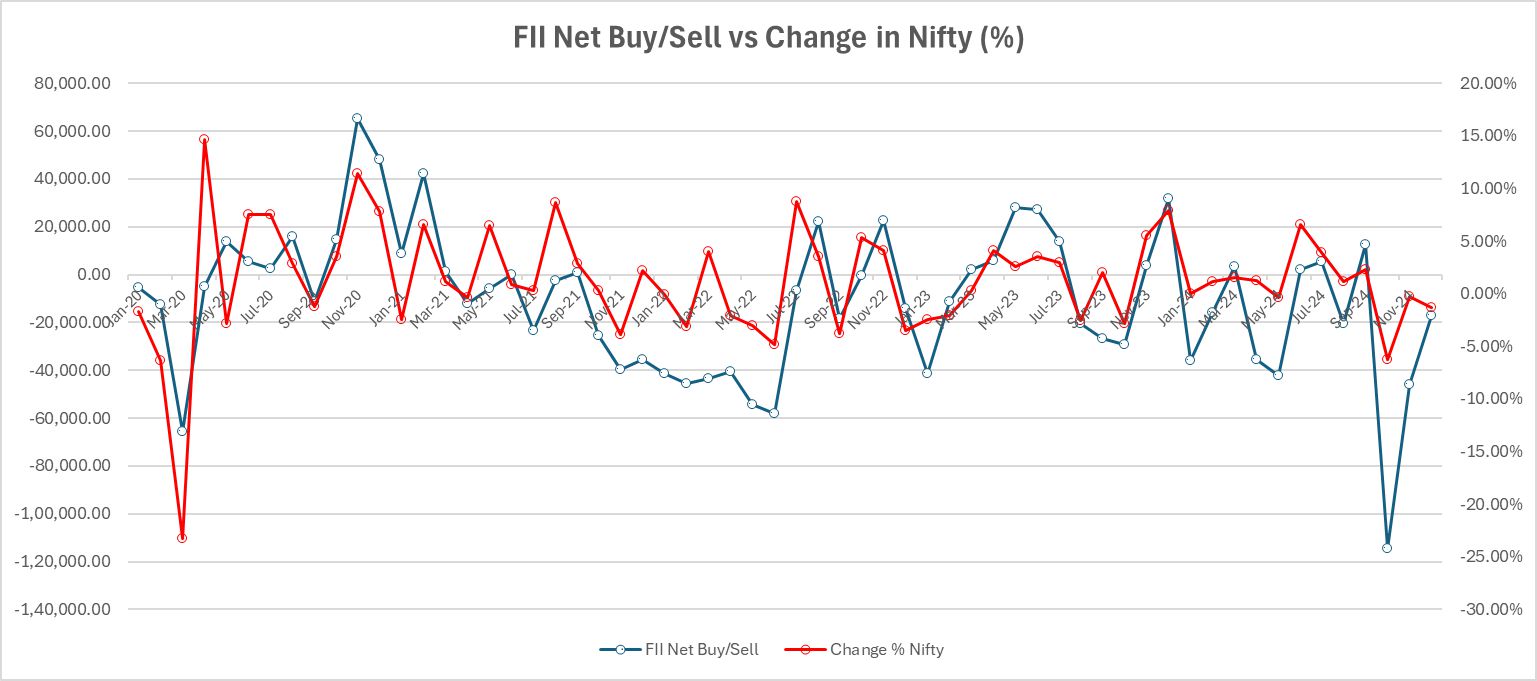
Over the past three and a half months, Indian markets have faced significant challenges, marked by substantial outflows from Foreign Institutional Investors (Flls), who have pulled out nearly 2 lakh crore during this period. The Nifty 50 has experienced a sharp correction, declining for three consecutive months with a cumulative loss of 12%. Similarly, small-cap and mid-cap indices have also corrected by 12-13%, reflecting widespread bearish sentiment.
In terms of relative performance, SPY’s significant outperformance over MSCI India took place between late September 2024 and January 2025. During this period, MSCI India declined by approximately 15%, reflecting a notable underperformance. In contrast, SPY posted a modest gain of 1.5%, resulting in a total relative outperformance of 16.5% by SPY.
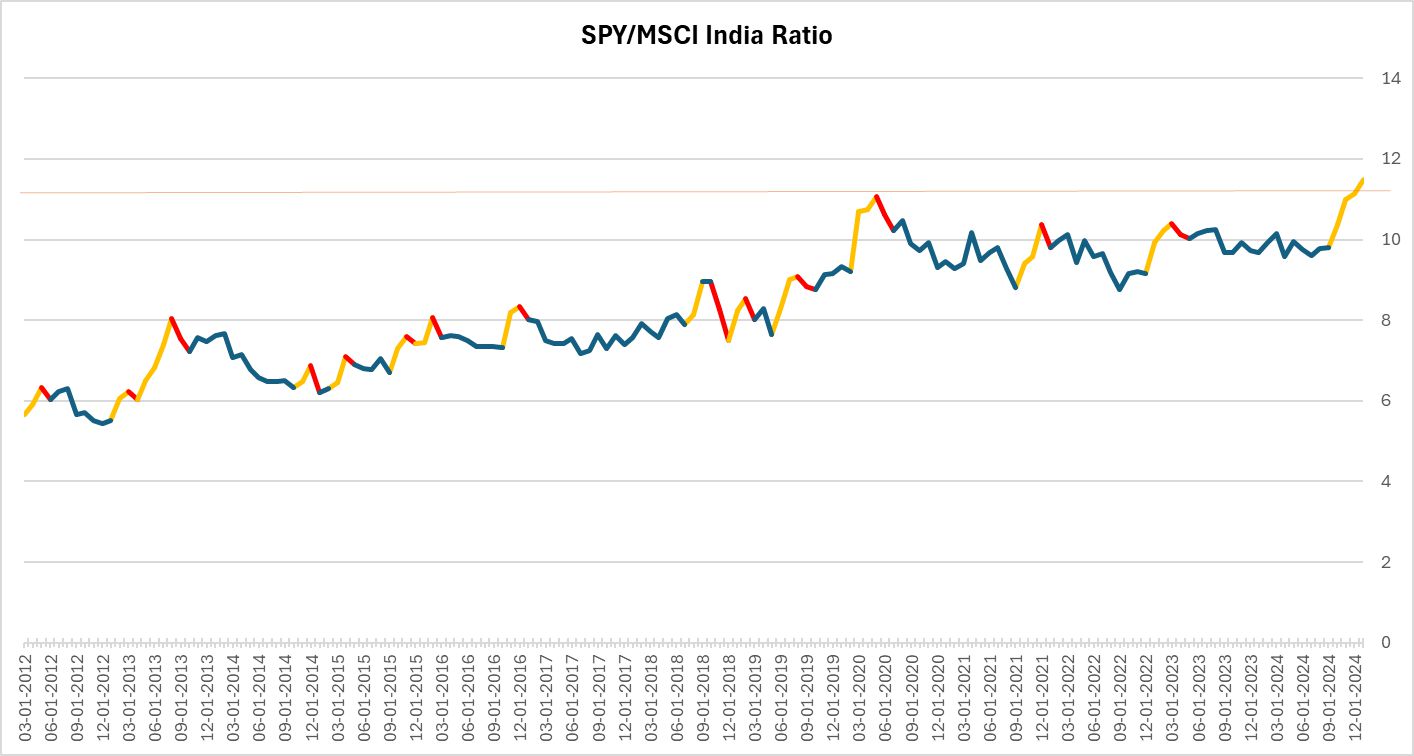
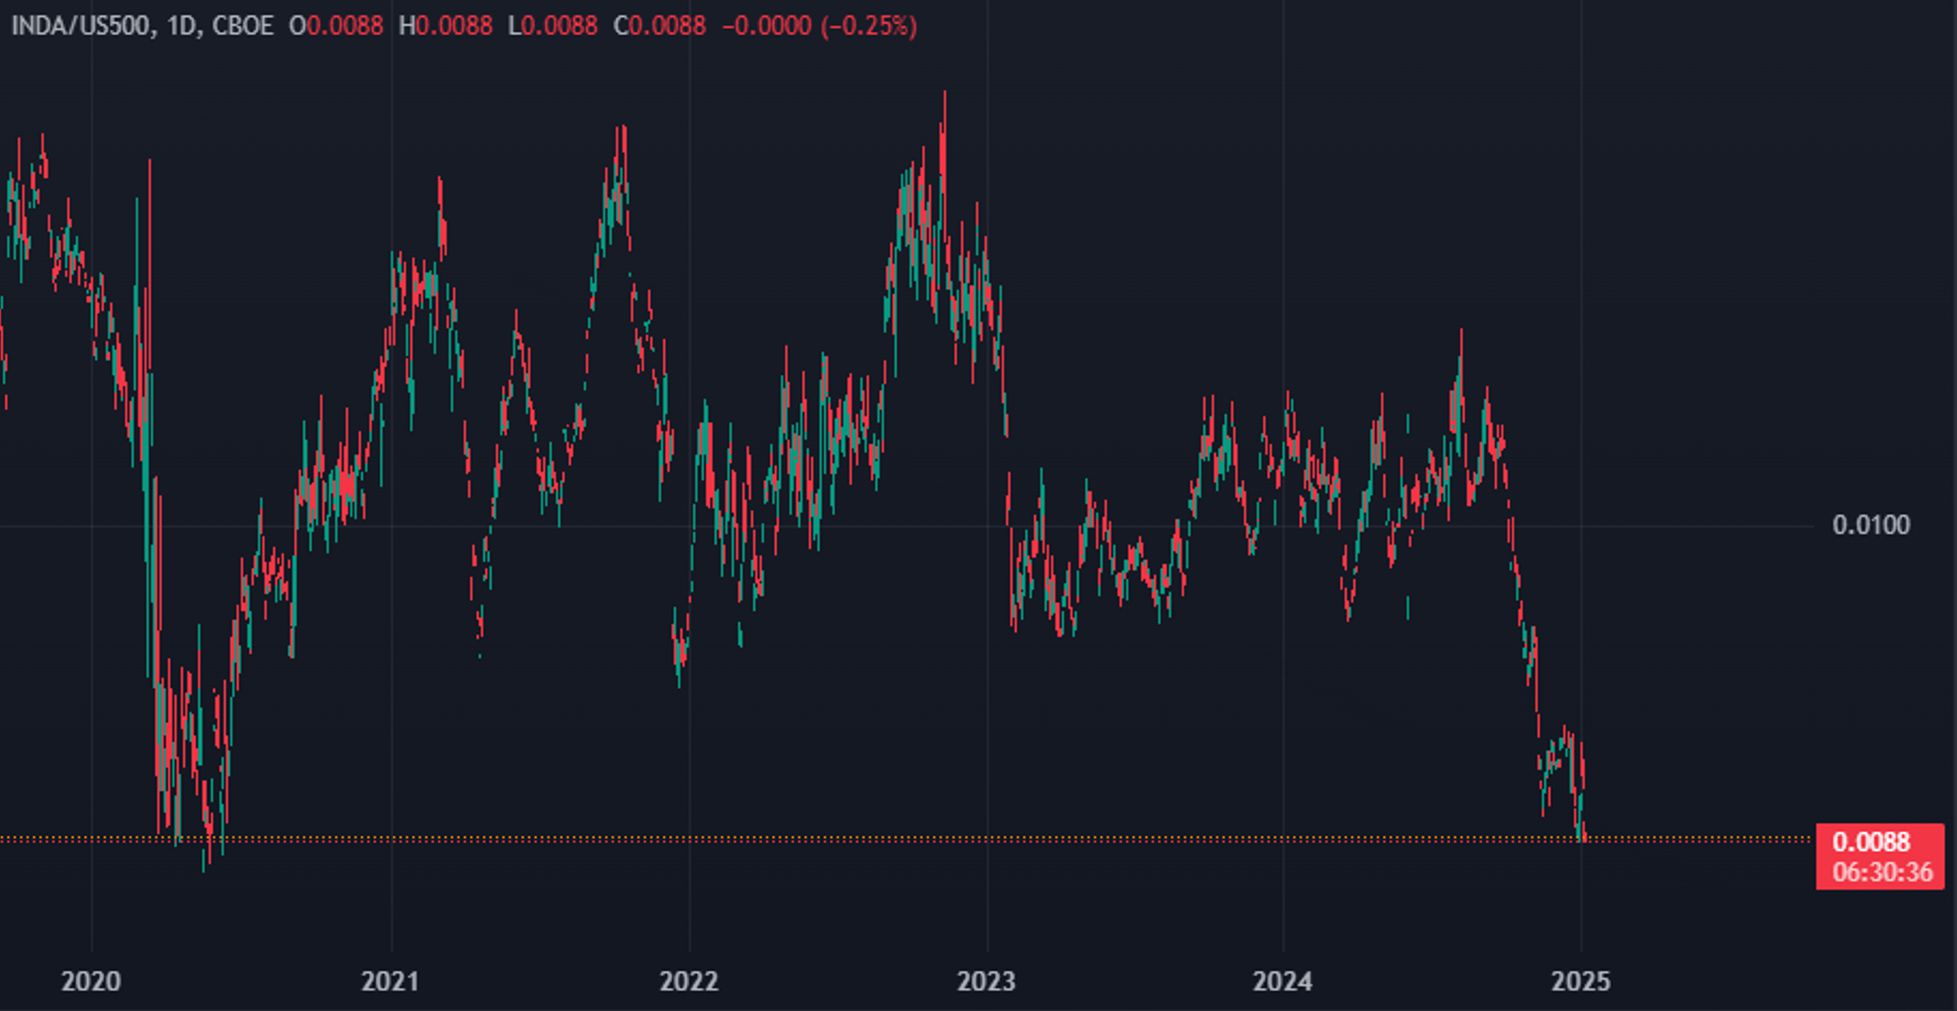
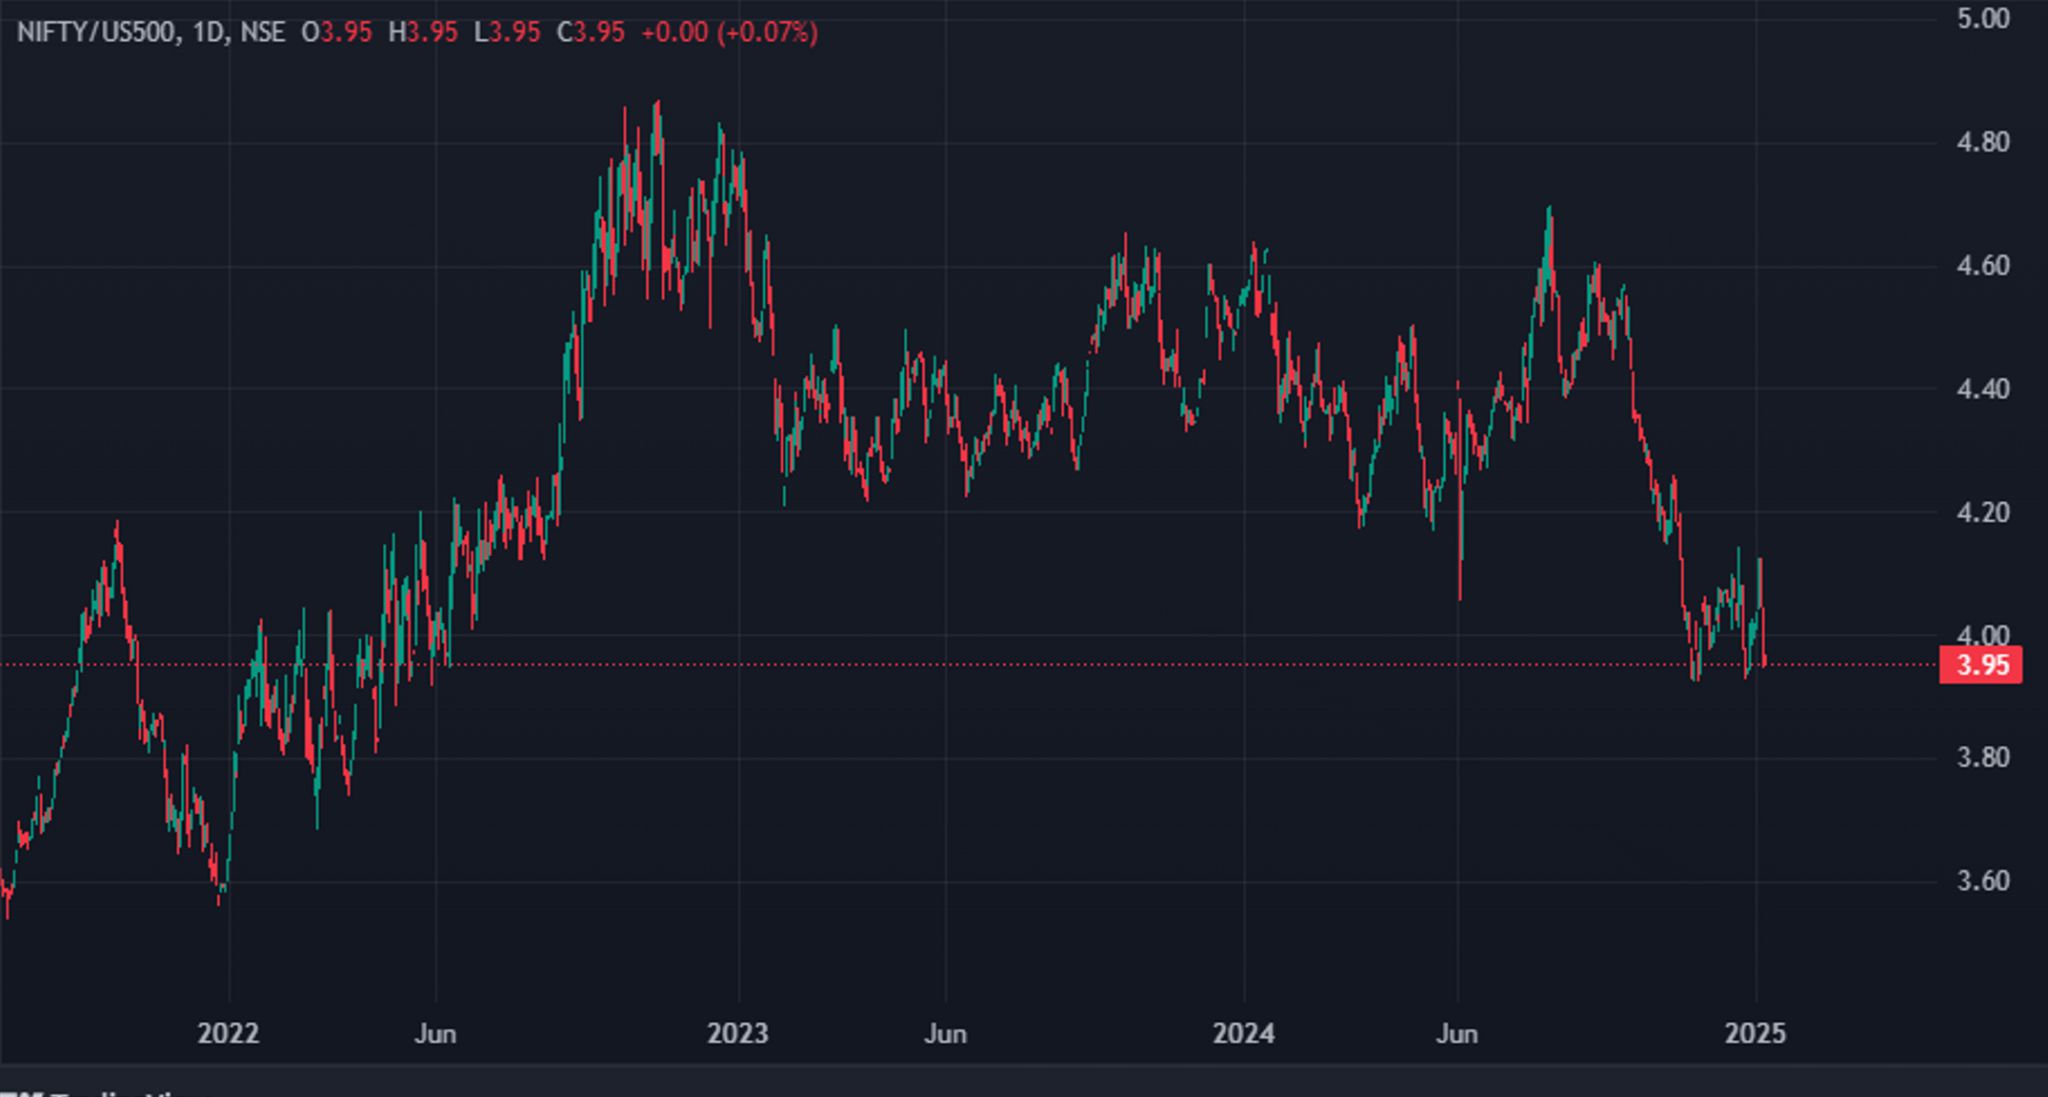
As shown in the graphs below (as of 7th January 2025), the MSCI India vs. SPY ratio has dropped to its lowest level of 0.0088 since the post-COVID-19 period. Similarly, the Nifty vs. SPY ratio is at its lowest point at 3.95 since mid-2022 (the considerably weaker performance of MSCI India relative to SPY can largely be attributed to the depreciation of the Indian rupee over the past few years).
This report presents a historical analysis and examines evolving macroeconomic factors to provide insights into the future direction of the markets.
Historical Analysis
To provide deeper insights, we analyzed historical data post the Global Financial Crisis (GFC), focusing on instances where Flls sold consecutively for 2-3 months and the Nifty fell by 5% or more during the period. The study evaluates market behavior following such patterns.
Additionally, we examined cases where MSCI India had underperformed SPY by 8% or more in a short span. This study identifies how markets responded 1 month and 3 months after such significant underperformance, presenting a detailed comparison of the number of instances and corresponding market recoveries.
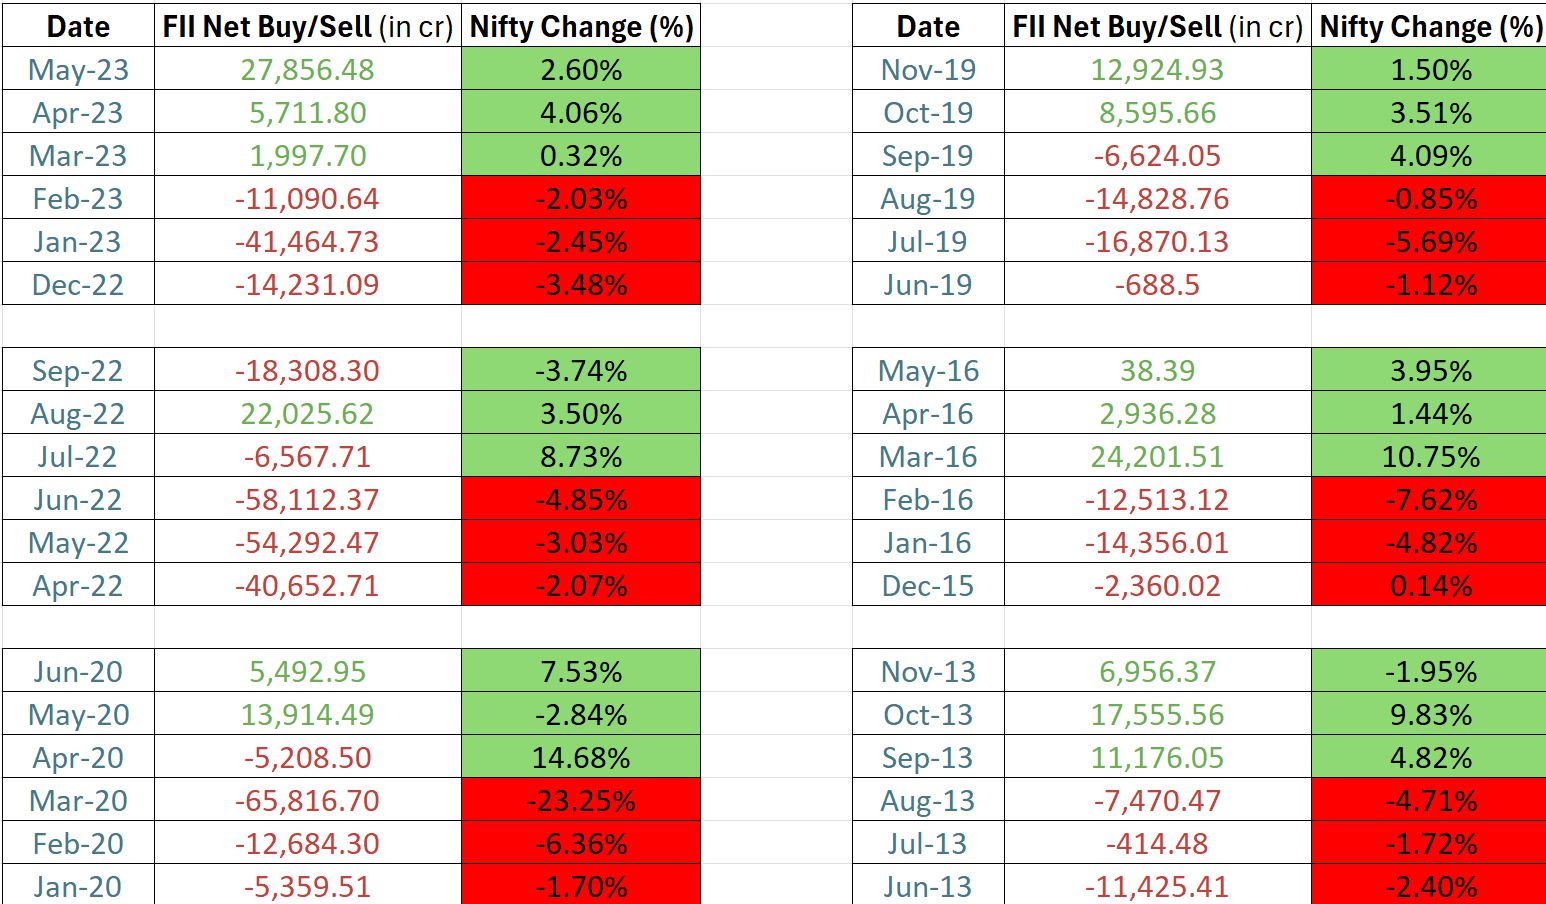
Correlation Between FII Selling and Nifty Performance
Analysis
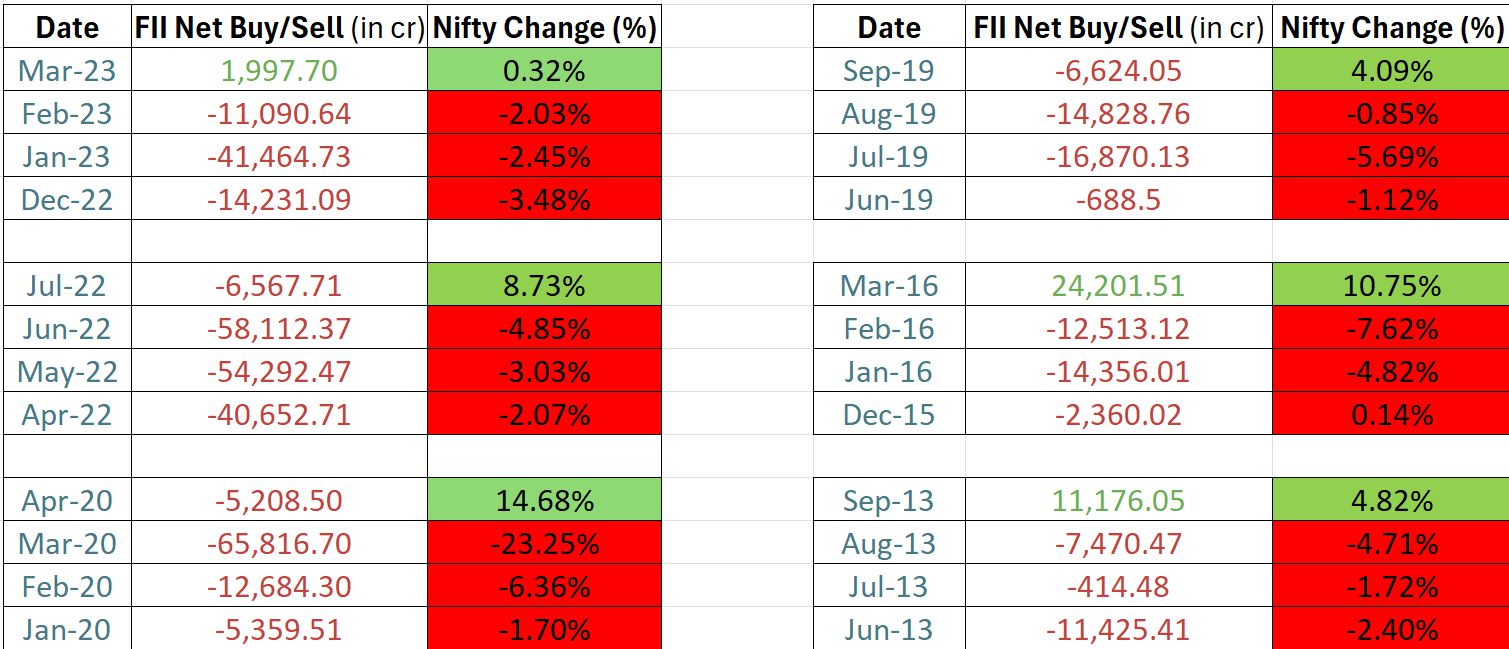
According to the tables above, Since 2011, there have been six instances where three consecutive months of FIl selling led to a decline of more than 5% in the Nifty, followed by a positive return in the fourth month. To understand the recovery dynamics, two separate studies were conducted. The first study (figure 1) analyzed the Nifty’s performance in the fourth month following the three-month selling period, while the second (figure 2) examined the index’s performance over the next three months. The results were striking. After three consecutive months of FIl selling, the average absolute return of the Nifty in the fourth month was 7.23%. Furthermore, when analyzing the Nifty’s performance over the subsequent three months (figure 2 in Annexure), the average absolute return was an impressive 12.13% (approximately 4% per month). Notably, the Nifty delivered positive returns in all six instances.
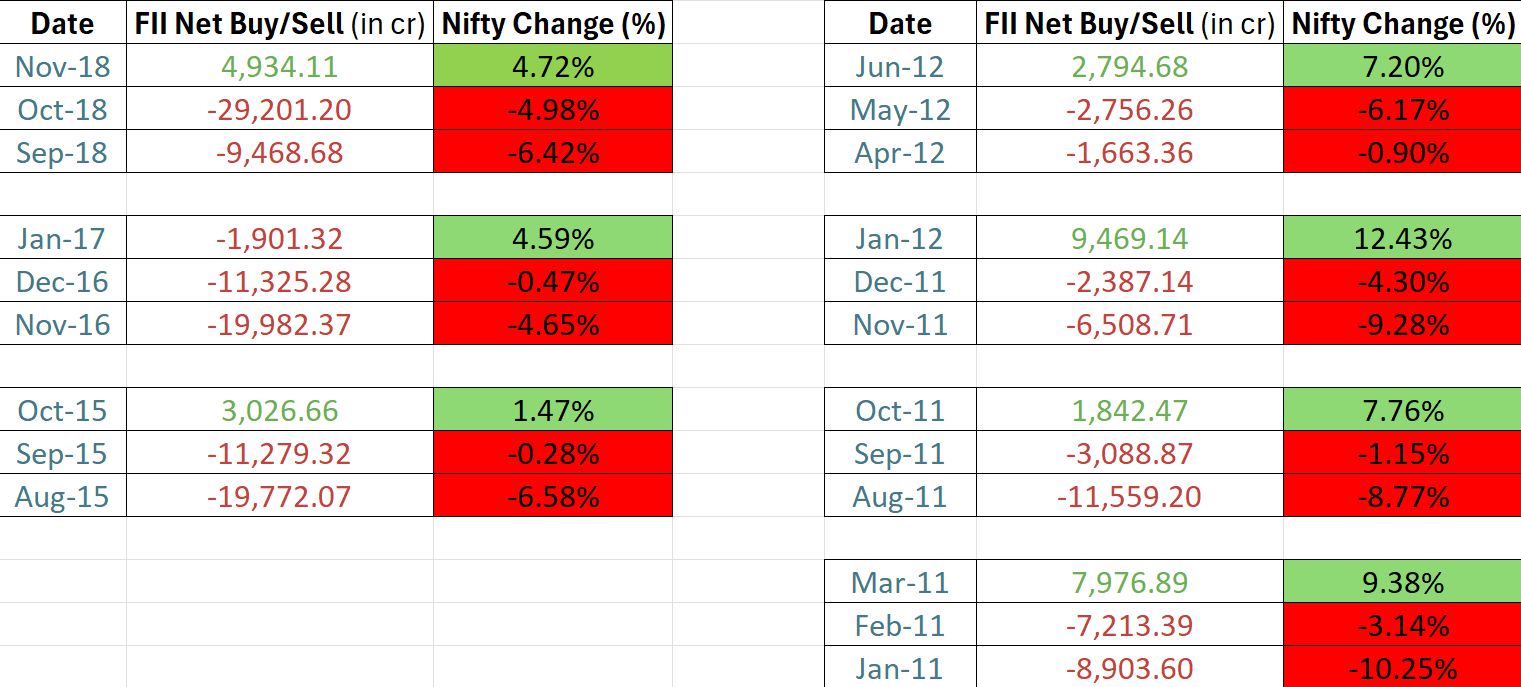
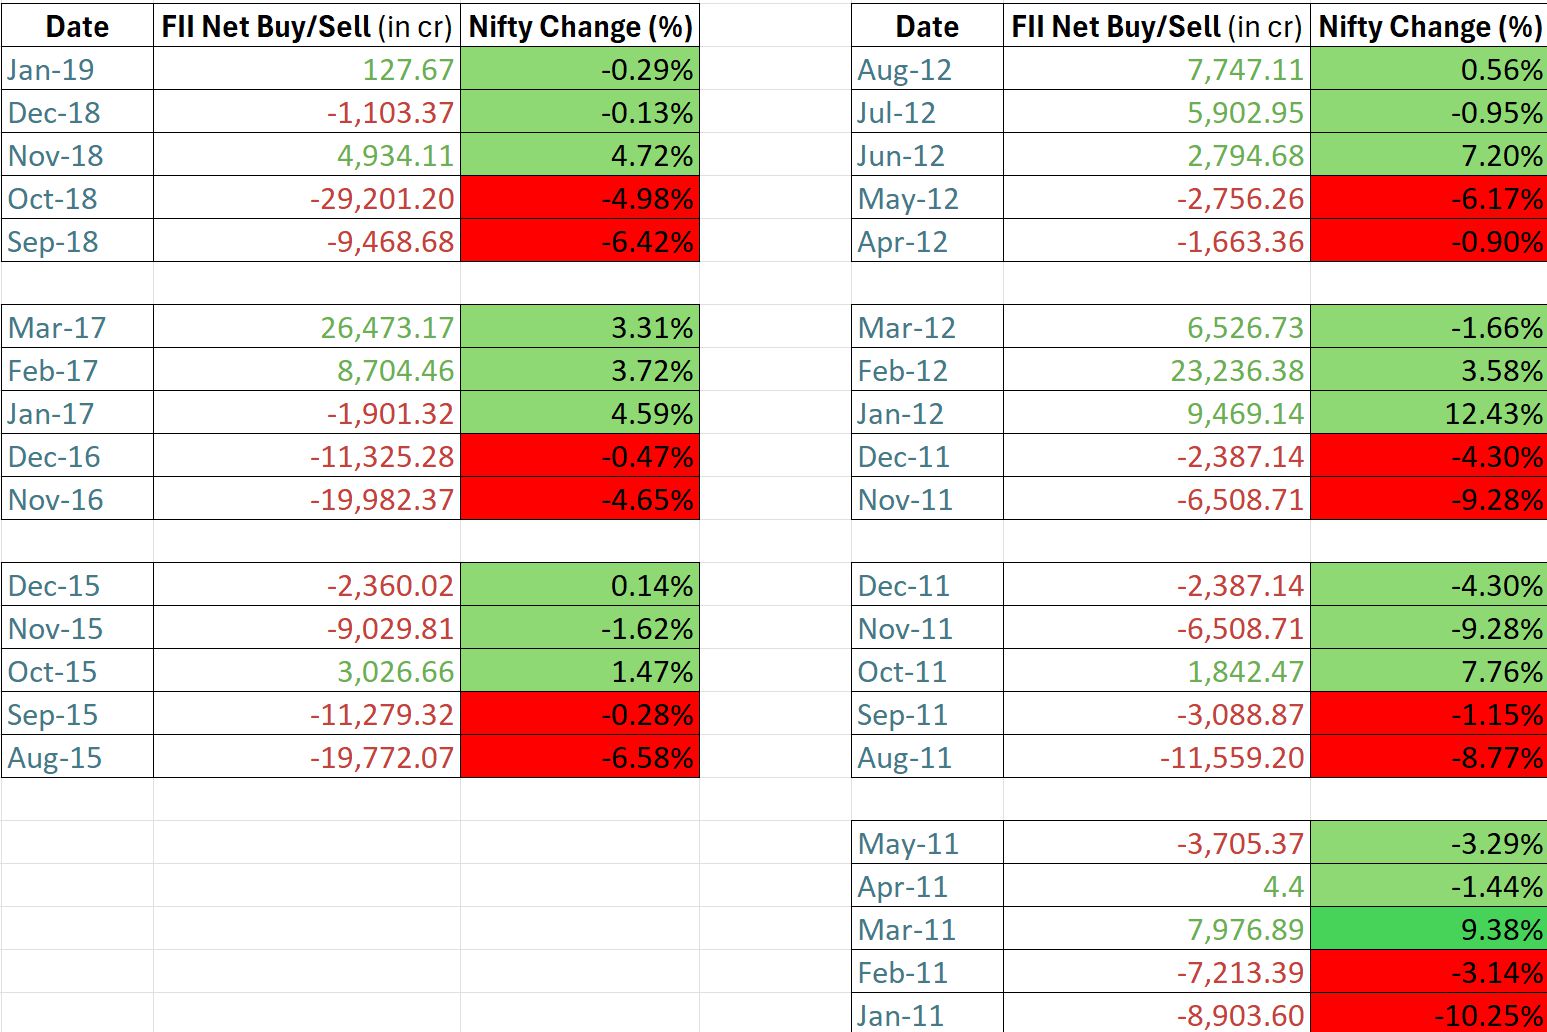
A similar analysis was conducted for periods of two consecutive months of Fll selling as shown in the figures above, followed by recovery phases since 2011. There were seven instances where two months of sustained FII selling were followed by positive Nifty returns. For these cases, the average return in the first month following the selling period was 6.79%, with all seven instances yielding positive returns (figure 3). Extending the analysis to the three months following the two-month selling periods (figure 4) revealed an average Nifty return of 5.13% over 3 months. Of these seven instances, five resulted in positive returns, one was flat, and one showed a negative return.
Findings
Periods of sustained Foreign Institutional Investor (FII) selling, particularly over two or three consecutive months, often result in significant declines in the Nifty, typically exceeding 5%. However, historical data reveals that these phases are frequently followed by notable market recoveries. This pattern of mean reversion suggests that the Nifty tends to deliver above-average absolute returns in the subsequent one- to three-month periods, creating opportunities for investors to capitalize on the rebound. The current scenario of continuous Fill outflows and negative Nifty returns over the last three and a half months aligns with this trend, indicating the potential for a recovery phase. Such historical consistency underscores the importance of viewing prolonged Fll selling as a precursor to attractive investment opportunities in the Indian equity markets.
Analysis of SPY and MSCI India Relative Performance Over the Last 12 Years
Figure 5
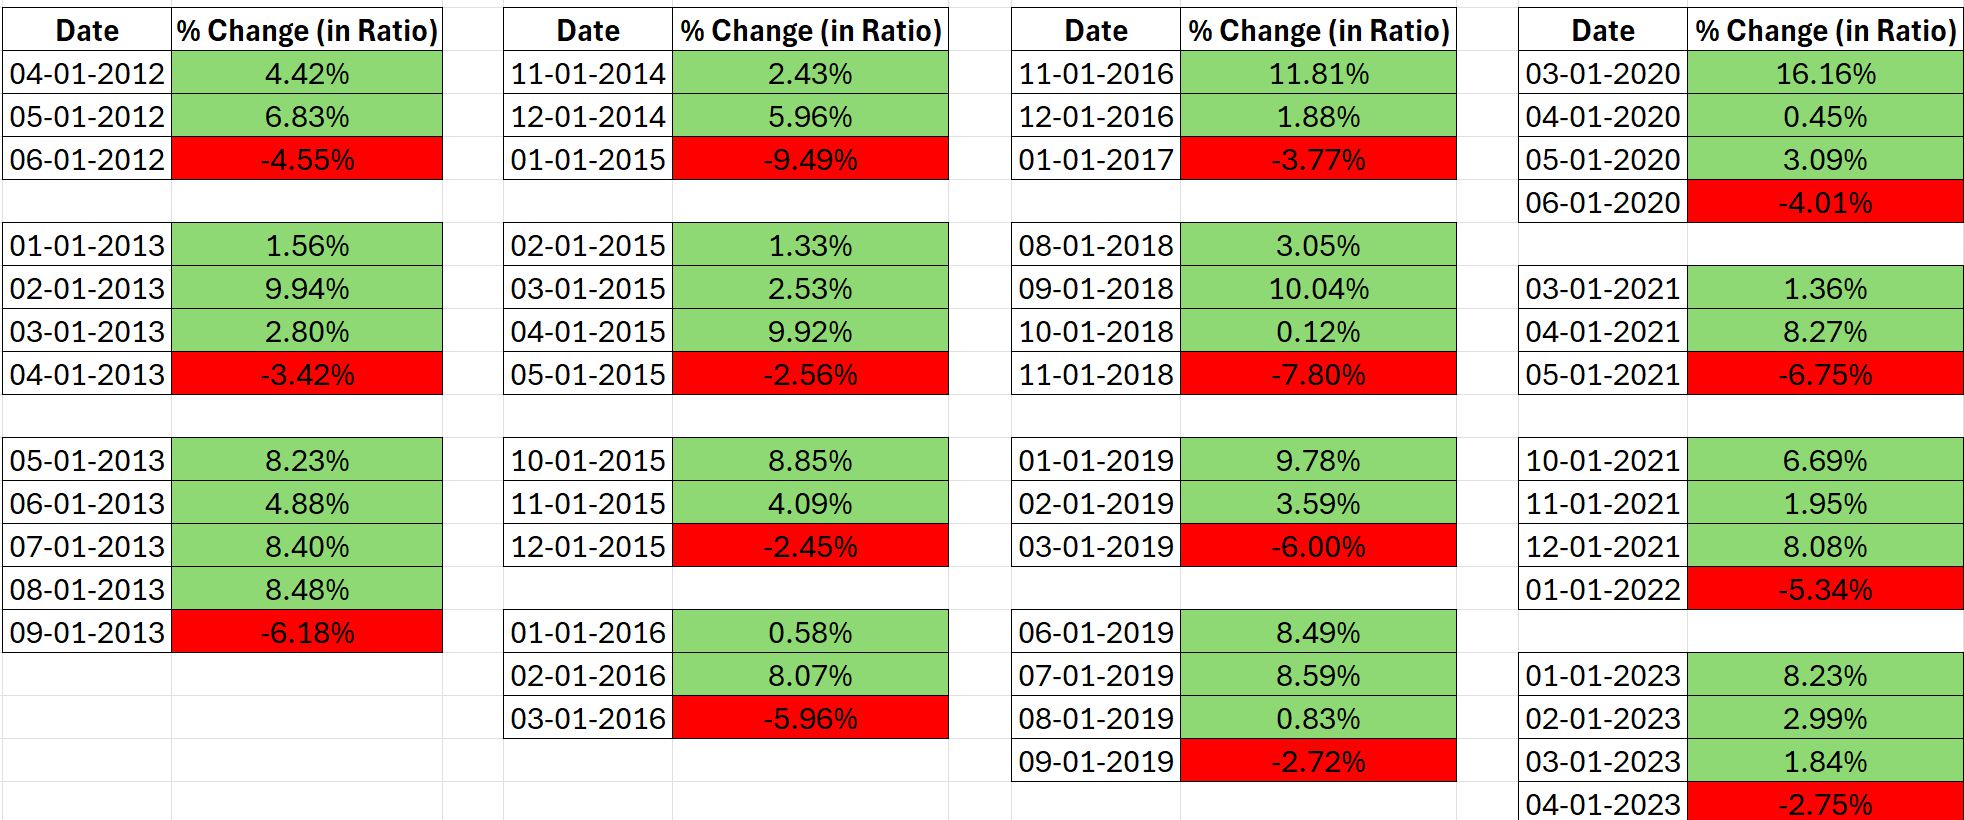
In the analysis of the MSCI India Index (iShares MSCI India ETF in dollar terms) following SPY’s (SPDR S&P 500 ETF Trust) outperformance on a one month basis, the index demonstrated strong absolute performance. Across 15 instances observed, the MSCI India Index delivered a total net return of 94.10%, which translates to an average monthly return of 6.79%. Notably, positive returns were recorded in 14 out of 15 instances, with only one instance of flat return, in. terms of relative performance, the MSCI India Index outperformed SPY in all 10 instances, with an average relative outperformance of 4.92%. This data, as shown in Figure 5, highlights the resilience and potential for rebound of MSCI India following periods of significant underperformance relative to SPY,
Figure 6
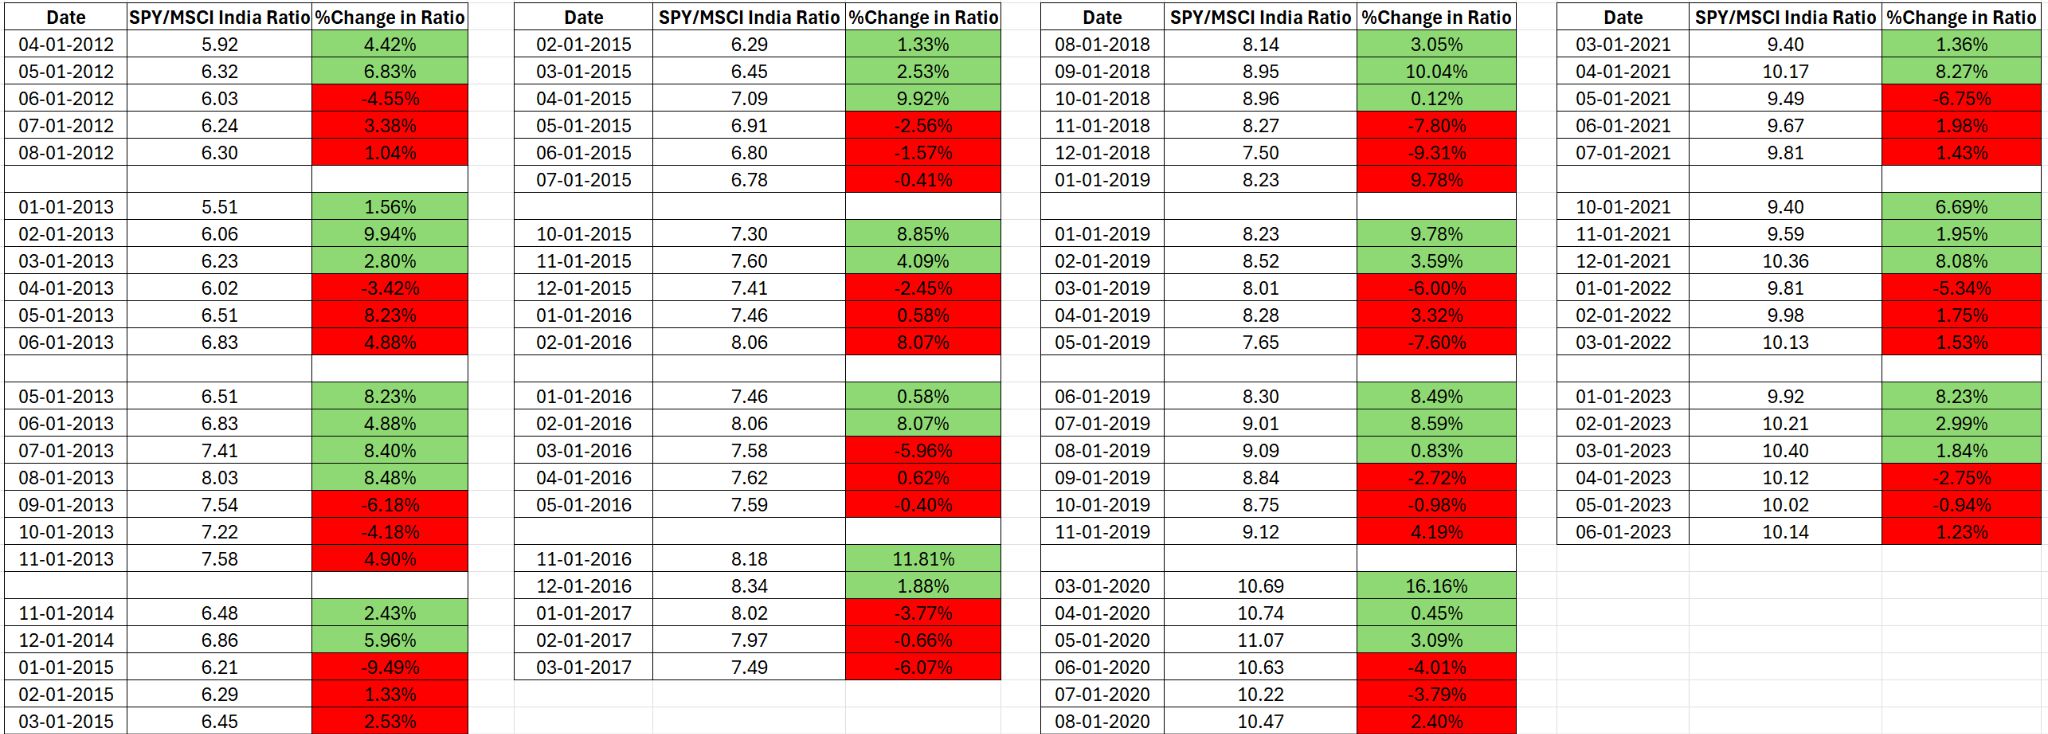
Similarly, we analysed the 3-month performance of MSCI India following SPY’s outperformance (as shown in Figure 6 above), the MSCI India Index exhibited robust absolute performance. Over the 15 instances analyzed, the index delivered a total net return of 112.02%, averaging 7.47% per period. Of these instances, 13 resulted in positive returns, while 3 showed negative retuns. In terms of relative performance, MSCI India outperformed SPY in 11 out of the 15 instances, underperformed in 2 instances, and matched SPY’s performance in 2 instances. On average, the relative outperformance of MSCI India over SPY during this period was 3.10%, demonstrating its resilience and tendency to regain leadership after periods of underperformance relative to the S&P 500.
Findings
The analysis underscores a consistent historical trend: SPY’s phases of notable outperformance have often been followed by reversals, with MSCI India rebounding strongly in both absolute and relative terms. Given this pattern, MSCI India appears poised for outperformance in the near term, particularly as the current setup mirrors previous instances where the index regained leadership after periods of underperformance. This observation aligns with broader market dynamics and suggests potential opportunities for investors to capitalize on the anticipated rebound in MSCI India.
Conclusion
In the second half of 2024, emerging market (EM) equities and currencies surged to elevated valuations amid extreme euphoria, driven by favorable macroeconomic conditions, particularly a dovish Federal Reserve and the commencement of the U.S. rate-cutting cycle, which began with a 50-basis-point cut in the third week of September. This raised concerns about potential reversals and prompted us to adopt a cautious and bearish stance on EM assets, which proved accurate as markets faced a significant correction over the past three and a half months. The downturn was driven by unfavorable macroeconomic factors, including a 9% surge in the Dollar Index over four months (peaking at 110.15), rising U.S. Treasury yields, and heightened fears of protectionist policies under the incoming U.S. administration. These factors collectively exerted downward pressure on EM assets, triggering widespread declines and concerns about reduced capital flows to these markets.
Looking forward, we anticipate a stabilization of these macroeconomic headwinds. Historical patterns suggest that similar sharp rallies in the Dollar Index and U.S. yields are often followed by periods of moderation and eventual decline. Market concerns about the incoming U.S. administration’s policies appear largely priced in, with actual policy implementation likely to be less severe than feared. These factors, combined with the extent of the recent correction, suggest that the bearish cycle in EM assets has largely run its course.
Historical data from the past 14 years reinforces our outlook. Our analysis of similar corrections in EM markets shows that such downturns are typically followed by strong rallies, particularly in EM equities excluding China (EMxC). Within this context, Indian equities stand out as especially well-positioned to lead the rebound. Robust high-frequency economic indicators and advanced corporate tax collections point to a stronger Q3 earnings season compared to the previous quarter. Additionally, the upcoming Indian Budget on February 1, 2025, is expected to be significantly more business and investor-friendly than the July 2024 Budget, adding further impetus to Indian markets.
As macroeconomic factors stabilize and historical patterns align, we expect Indian equities to deliver positive returns over the next one to three months. Moreover, Indian markets are likely to outperform both the broader EM basket and the S&P 500 (SPY), supported by favorable domestic fundamentals and improving global sentiment. Nifty could deliver a return of 7-8% over the next one to three months and MSCI India could outperform SPY by 8-10% in the same time period. With the correction phase now behind us, we are increasingly optimistic about a mean reversion rally in EMxC, led decisively by India.
Recommendation
Our suggestion is to focus on Large-cap stocks, which we believe offer significantly more upside potential compared to small-and mid-cap stocks at this stage. Over the last 3.5 months, the Fill exodus has made large caps relatively more investable, whereas valuations for small- and mid-cap stocks remain less attractive due to sustained domestic inflows. Within this large-cap bias, we aim to prioritize stocks with an average P/E ratio lower than that of the Nifty 500, coupled with strong earnings visibility over the upcoming quarters. We also seek companies with robust balance sheets that align with the preferences of more conservative investors and portfolios.
Additionally, we emphasize investing in liquid stocks to minimize the impact cost during transactions, ensuring greater flexibility in portfolio management. Given that we are in the relatively mature stages of the current macroeconomic cycle, our approach favors companies with low leverage and minimal refinancing challenges, reducing exposure to risks associated with high debt levels. This strategy aims to balance growth potential with stability and risk mitigation.


Comments are closed.