Introduction
At the end of CY 2022, there was nearly a consensus among economists and institutional investors that the US economy was going to hit a recession in CY 2023. We were not anticipating a recession at the time since the US economy had strong underpinnings in the form of strong consumer demand, particularly in the travel and leisure sector. This report will explain various factors that have actually led to strong economic growth in the US in CY 2023. We also believe that there is a high probability that the US is going to enter a slowdown by the second or third quarter of CY 2024. This report will also showcase some leading indicators predicting a recession in the US in CY 2024.
The image above illustrates that in the United States, disposable income and compensation growth have consistently surpassed inflationary rates over the past year. This trend of disposable income and employee compensation outpacing PCE Inflation has been the most important contributor to US economic growth in CY 2023 as consumer spending represents 70% of the US economy and has a significant multiplier effect that helps boost the remaining components of the US economy. Robust consumer spending supported by rising disposable income and excess savings from the pandemic years, was one of the most important factors behind the tremendous performance of the US economy.
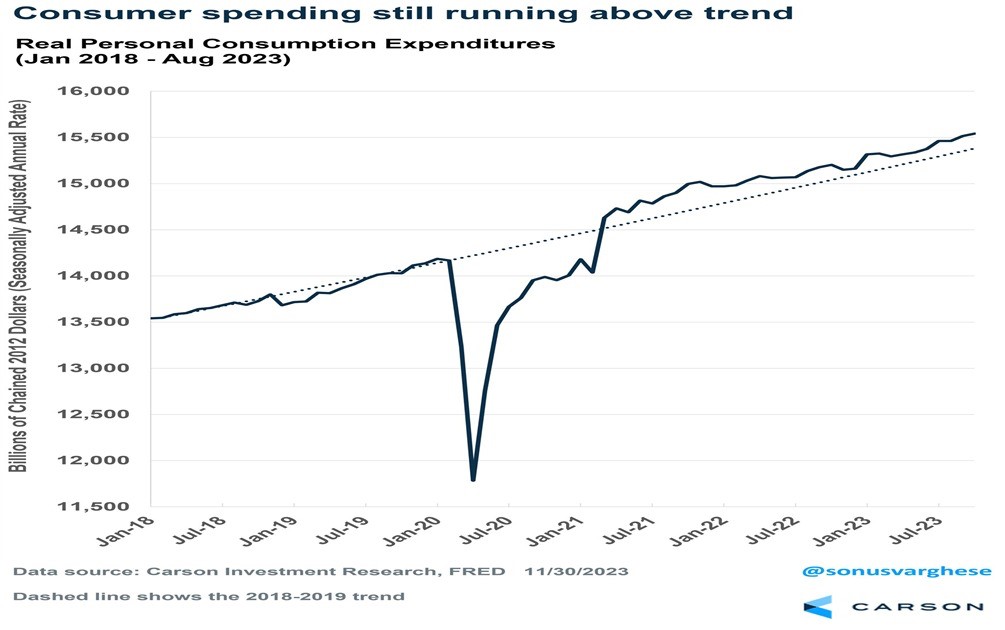
This chart further depicts that real Personal Consumption Expenditures (PCE), a metric gauging consumer spending adjusted for inflation, have consistently exceeded their typical trajectory post the COVID-19 pandemic recession. As of August 2023, real PCE stood 15% above its prepandemic level since February 2020, indicating sustained consumer resilience post-recession. Despite the prevalence of high inflation and escalating interest rates, consumers have displayed continued spending vigour, showcasing their relative durability in the face of economic challenges.
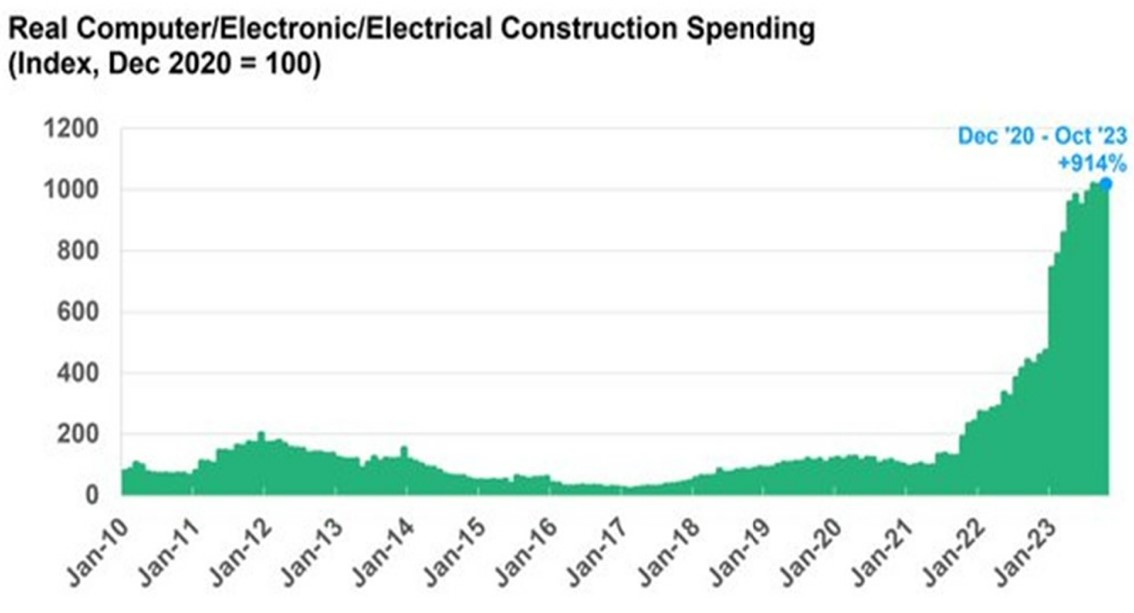
The graph above shows the growth of real computer/electronic/electrical construction spending from 2020 to 2023. Real computer/electronic/electrical construction spending has increased by over 900% from December 2020 to October 2023. This is an incredible growth rate and is indicative of the unprecedented demand for computer/electronic/electrical manufacturing in the United States. The most important reason for this rise is the attempt by the US to reduce its dependence on Asia for the supply of semiconductors and other critical components needed to run the entire digital infrastructure. On similar lines, the US is promoting the building of EV battery plants, clean energy infrastructure, and basic infrastructure such as ports, airports, and roads. This is supported by various acts passed by the Biden Administration using US fiscal spending, which have collectively given a significant boost to manufacturing, commercial construction, and consequently US GDP in CY 2023.
Why we predict a US recession in CY 2024
Many of the tailwinds for the US economy in CY 2023, such as robust consumer spending, pent up demand for services, fiscal pump priming, and positive wealth effect from rising equities, have already played out. With consumers’ excess savings depleting, rising consumer debt, burden of repaying education loans, and a higher base effect of CY 2023, puts pressure on the US government to reduce deficits with an acute slowdown in Europe now providing an extremely difficult backdrop for the US economy in CY 2024. This is manifested in some of the charts given below even though they are not exhaustive by any yardstick.
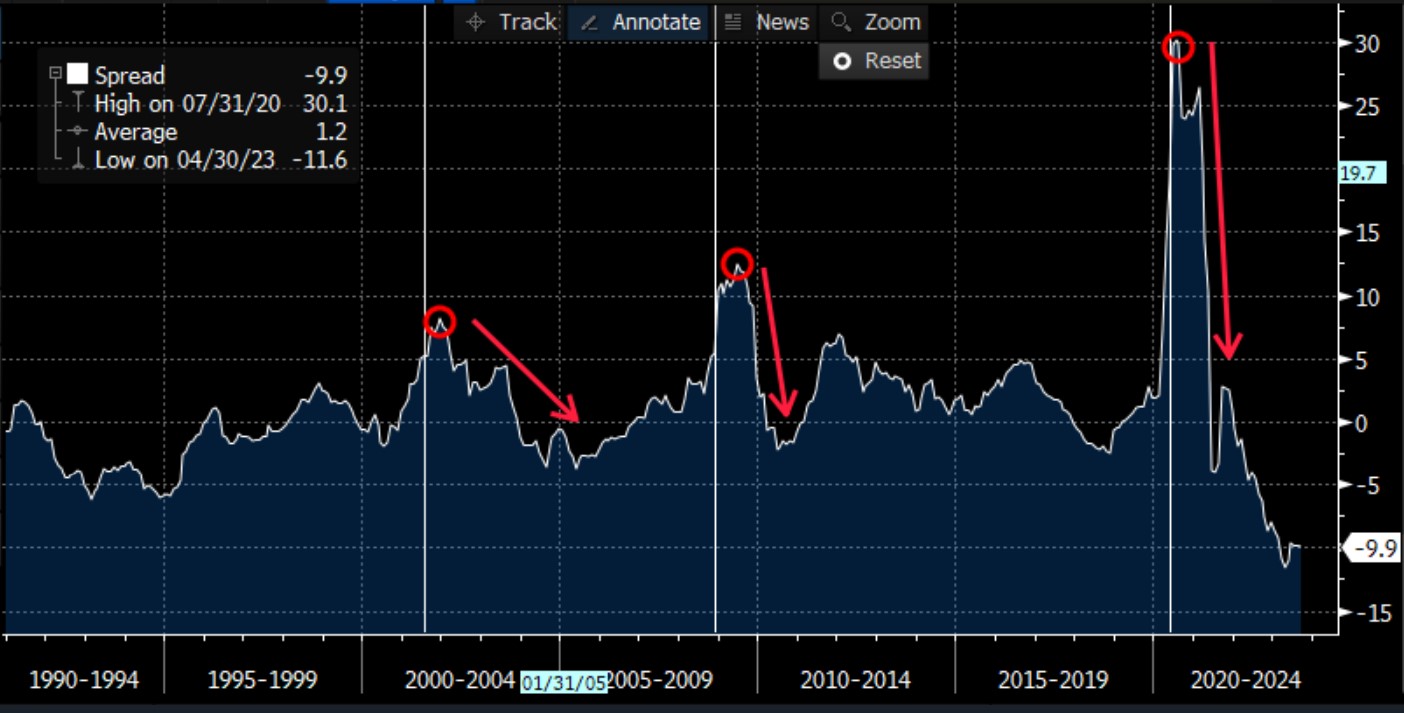
Fig 4. Spread Chart of M2 and Nominal GDP (YoY Change)
If M2 growth surpasses the growth rate of nominal GDP on a year-over-year basis, it suggests that the money supply is expanding at a faster pace than the overall economy. This scenario is potentially expansionary and, in the past, has been associated with stable to strong economic growth.
Conversely, if the growth rate of nominal GDP outpaces that of M2 on a year-over-year basis, it indicates that the money supply is not growing fast enough to continue supporting strong economic growth. This is often triggered by the central bank in its efforts to contain inflation. As we would note from the graph above, negative readings or sharp falls on the above measure have almost always been followed by a sharp slowdown or a recession. In CY 2023, we have had the worst reading in many decades. Since this is a leading indicator, it clearly points to an evolving slowdown and a recession in the US.
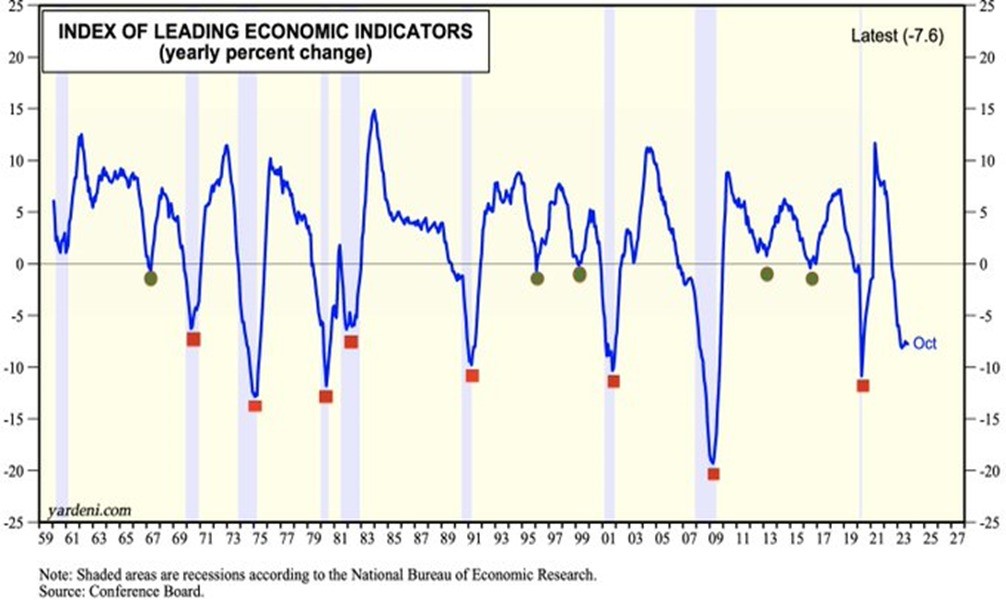
The Conference Board’s Leading Economic Index (LEI) for the United States is a compilation of ten key economic indicators that forecast future global economic trends. The LEI has nearly a 100% track record in predicting US recessions, consistently reaching its peak before a recession starts, then falling as the economy heads towards a recession, and eventually hitting its lowest point during the recession. In October 2023, this index dropped by 0.8% to 103.9, marking a 7.6% contraction over the past year. A sharp decline in the LEI since its peak in early 2022 over the last one and a half years is clearly pointing to a heightened possibility of a recession in the US in CY 2024. Never before in its history has the LEI fallen so much from its peak without being followed by a recession. There is no reason to expect something different this time around.
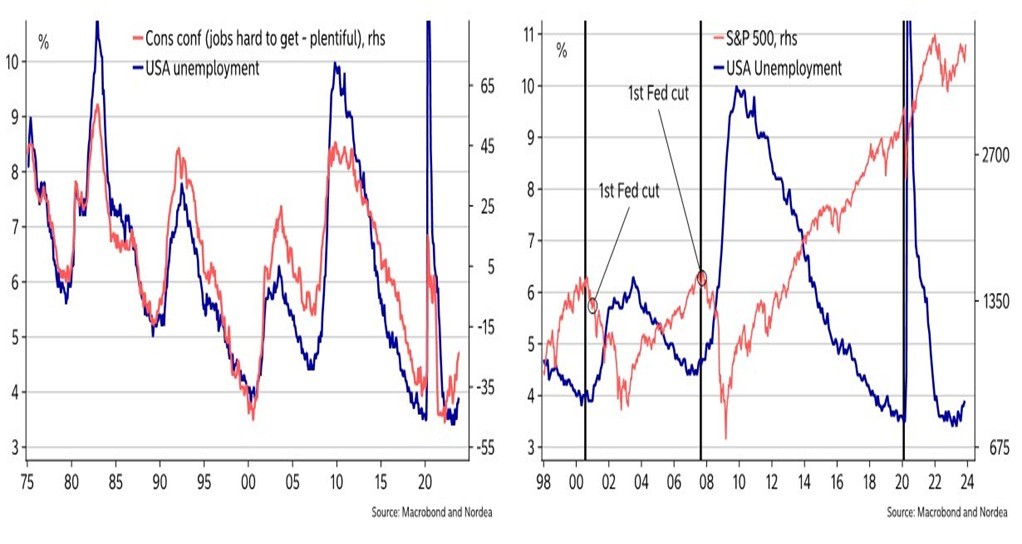
The above charts showcase the complex interplay between Fed policy adjustments, consumers’ confidence about immediate job prospects, the unemployment rate, and the onset of a slowdown. Typically, the unemployment rate bottoms slightly before a recession hits the economy, then rises with individuals finding it harder to get jobs when, finally, a recession unfolds. 7 months ago, the unemployment rate bottomed out at 3.1%, and there is considerable worsening in job sentiment among the working-age population. These factors clearly point towards the possibility of a US recession in CY 2024.
Conclusion
The macro backdrop of the US and the world economy clearly points towards a very high probability of a US recession in CY 2024. Apart from the indicators mentioned in this report, there are countless other signals pointing in the same direction. We expect a long and protracted US recession between CY 2024 and CY 2026. With China in economic disarray and Europe already in a serious slowdown, a US recession in CY 2024 could easily snowball into a global recession. This would very obviously result in a protracted bear market for global equities that may last a few years. Safe havens like gold and long-term US Treasuries bonds will probably be the prized asset classes for CY 2024 and CY 2025.




Comments are closed.