
 by Amit Goel
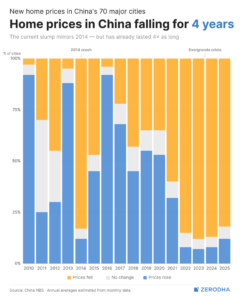
Every year since 2022, new home prices have fallen in at least four out of every five of China’s 70 major cities, and the “no change” category that used to cushion the market has almost disappeared. The closest historical parallel is 2014, when prices fell in roughly 83% of cities in a single sharp correction. That slump lasted about two years and had mostly reversed by 2016, when 92% of cities were posting gains again. The current downturn has already run twice as long with no comparable rebound in sight, which raises the question of what’s different this time. The next two charts point to the same answer from opposite sides of the market: money is going in, and buyers showing up.
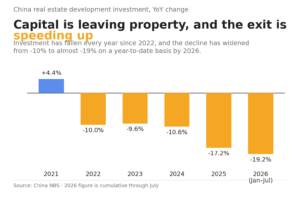
In 2014, developers kept building even as prices dropped, so investment growth stayed positive and supply caught up with demand within a couple of years. This time, capital has been leaving the sector every year since 2022, and the pace has kept deepening rather than stabilizing: a 10% annual decline in 2022 has widened to almost 20% on a year-to-date basis through July 2026. That is not a temporary pause in building activity; it’s developers structurally scaling back new projects because the return on doing so no longer justifies the capital, which removes one of the mechanisms that historically pulled the 2014-15 slump out of its dip.
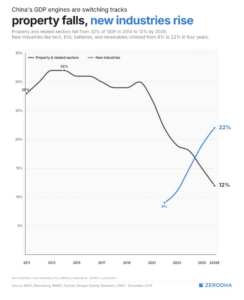
This is what makes the capital withdrawal in Exhibit 2 look deliberate rather than just cautious. Property and related sectors peaked at 32% of China’s GDP in 2014, roughly the same year the first price crash hit, and have since been cut to 12% by 2026, with the sharpest part of that decline arriving exactly as the current price slump began. Over the same four years, tech hardware, EVs, batteries, and renewables have gone from 9% to 22% of output, a mirror image of the drop on the other line. Beijing isn’t waiting for property investment to come back; the economy’s center of gravity has already moved somewhere else.
Conclusion
Read together, the three charts describe a rotation rather than a rough patch. Home prices have been falling for four straight years with no 2014-style rebound, investment into the sector is contracting faster each year instead of leveling off, and property’s own share of GDP has shrunk from 32% to 12% while an entirely different set of industries has grown to fill most of that gap. That sequencing suggests the price slump is a symptom of a policy choice already in motion, not a shock still waiting to be reversed. It carries a real cost, since land sales still fund a large share of local government budgets and housing remains most households’ main asset, so consumer spending and municipal finances stay exposed for as long as the transition runs. But it also means the usual playbook for calling a bottom, waiting for investment or prices to stabilize on their own, may not apply here: the capital that used to flow back into property increasingly has somewhere else to go instead.