

 by Amit Goel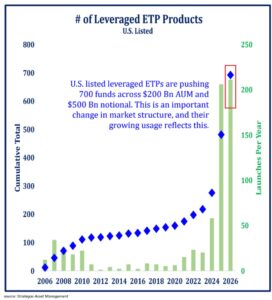
The number of US-listed leveraged ETP products is now approaching 700 funds — more than double the count seen at the end of 2024 — carrying over $200 billion in AUM and $500 billion in notional exposure. What makes this remarkable is not just the cumulative total but how quickly it was reached. For nearly fifteen years from 2006 to 2020, the leveraged ETP universe grew steadily but modestly, adding products at a pace markets could absorb without structural consequence. What followed 2020 was an entirely different story — annual launch rates that had never exceeded 60 in any prior year suddenly surged past 200, and in 2026 that pace has accelerated further still.
More than 400 of these nearly 700 funds are leveraged single-stock ETFs — a product category that barely existed five years ago. Investors are no longer seeking amplified exposure to broad markets. They want concentrated, directional bets on individual companies, and the financial industry is responding by manufacturing exactly that at a record rate. More than 210 new leveraged funds have already launched year-to-date, surpassing the entire full-year count of 2025. In June alone, 117 such funds debuted. As the chart states directly — this is an important change in market structure, and what the data in the following charts reveal is precisely why that change matters.
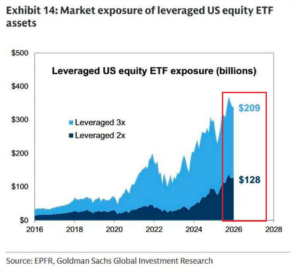
If the first chart showed how rapidly the number of leveraged products has multiplied, this chart reveals what that multiplication means in dollar terms. For nearly a decade from 2016 to 2020, leveraged ETF exposure grew gradually within a range markets could absorb. What happened after 2020 was different in kind, not just degree — exposure went vertical, compounding year after year at a pace with no historical reference point, ultimately reaching a combined $337 billion the market had simply never encountered before. The mechanical buying and selling of these productsare no longer a footnote. It is a structural force in daily price action.
The shift in composition is equally telling. The growing preference for the highest available leverage tier signals a step-change in risk appetite among retail participants. What was once an aggressive specialist instrument was moved into mainstream retail portfolios at a scale that represents an unprecedented behavioral shift in how individual investors engage with equity markets. This appetite is not random — it is driven by the relentless momentum in specific sectors, which the next chart reveals in detail.
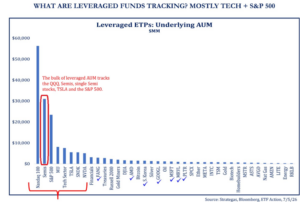
The previous two charts showed how many leveraged products exist and how large the total exposure has become. This chart answers what matters most — where is all that leverage pointing? The answer is striking. The bulk of leveraged AUM tracks just three things: the Nasdaq 100, semiconductors, and the S&P 500. Everything beyond that is a long tail of minimal size. This is not broad diversification — it is an amplified, concentrated bet on the AI and technology mega-cycle continuing without interruption.
This concentration creates a self-reinforcing feedback loop on the way up and a dangerous amplification mechanism on the way down. As these names rise, leveraged values increase, attracting more inflows, driving more rebalancing buying into the same names. But if this concentrated pocket corrects — through earnings miss, export restriction, or macro shock — forced deleveraging would amplify the selloff far beyond what fundamentals alone would justify. Everything falls together, through the same exit, with no natural buyer on the other side. All three charts ultimately describe the same structural reality — more products, more exposure, all pointing at the same trade.
Conclusion
The medium-term structural risk is more subtle. When an entire market recovery is funded by a single sector while capital is actively being withdrawn from everything else, it means the rally has not been confirmed by the real economy. The absence of rotation into cyclicals, industrials, energy, and financials — the sectors that typically lead to a genuine economic recovery — is not a minor observation. It is a fundamental breakdown in market breadth that exposes the current move as a positioning trade rather than a fundamental one. And positioning trades have a defining characteristic that fundamental recoveries do not — when sentiment shifts, they do not correct gradually. They unwind fast, violently, and without warning.